Projects
Climate Maps
NOAA's National Climatic Data Center (NCDC) is the world's largest archive of weather data. Much of the data are freely available for download on their website.
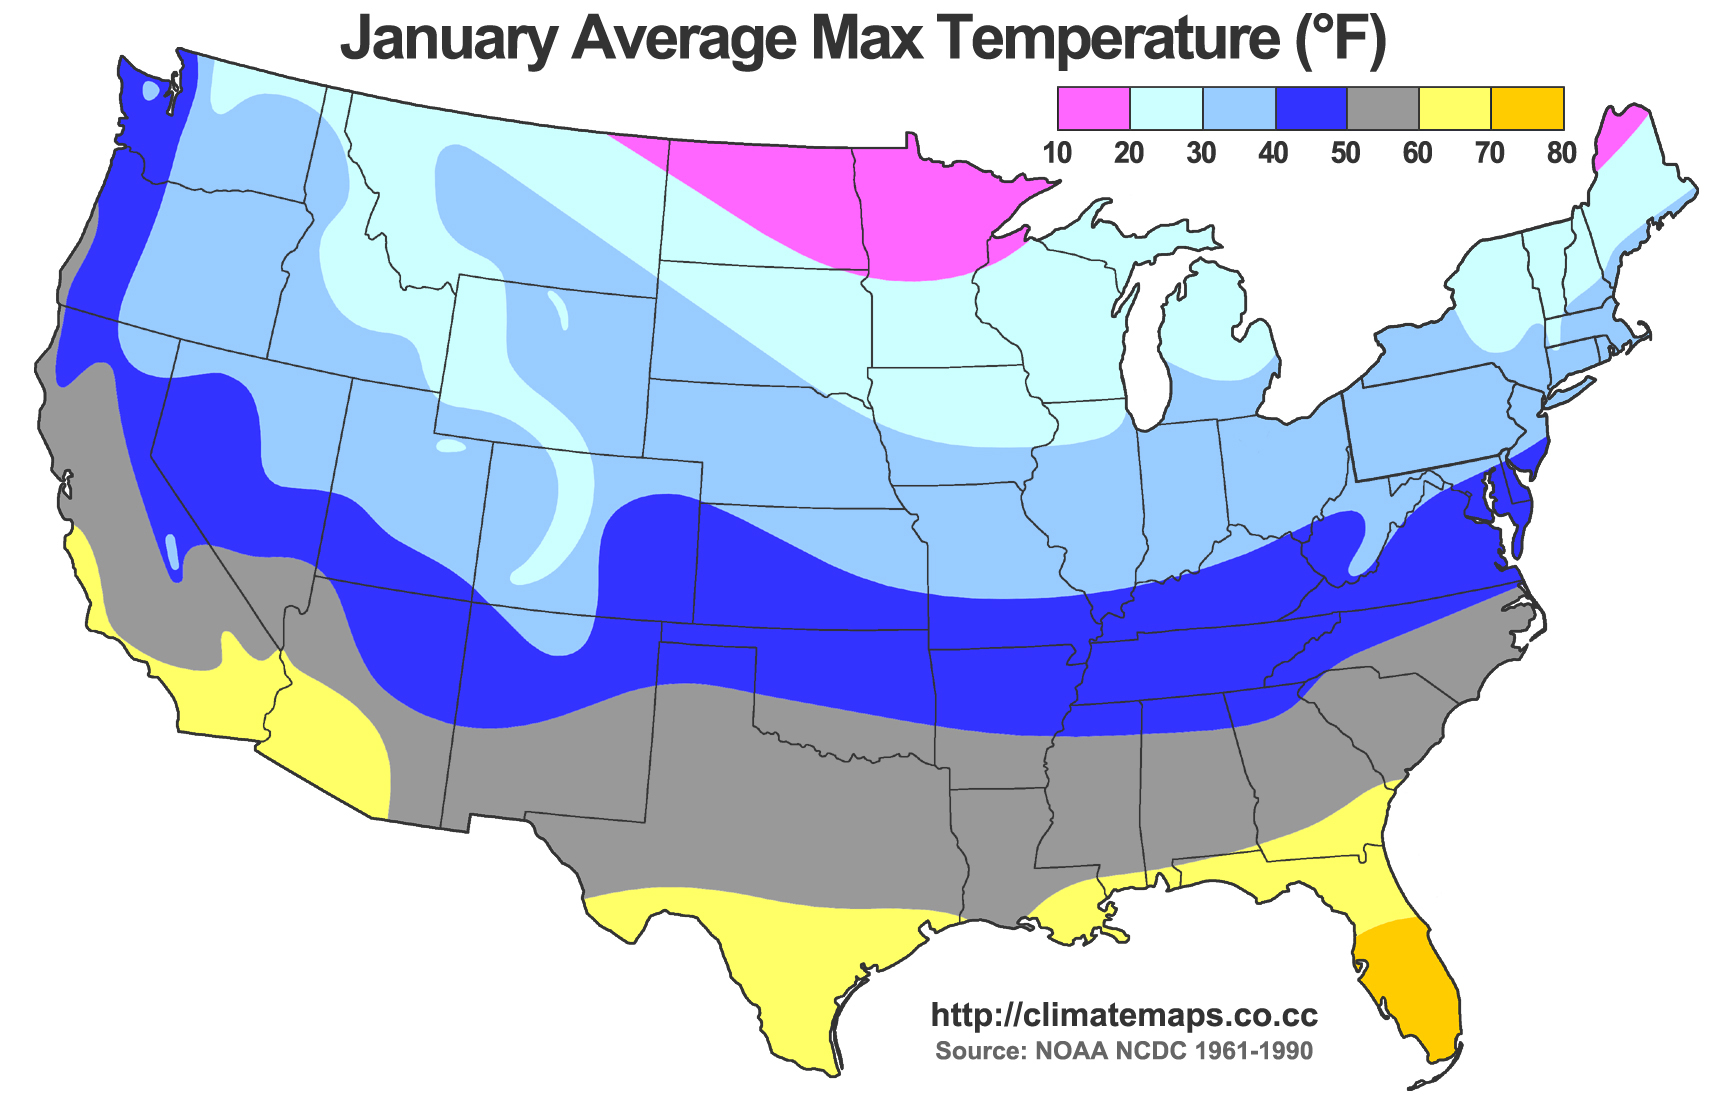
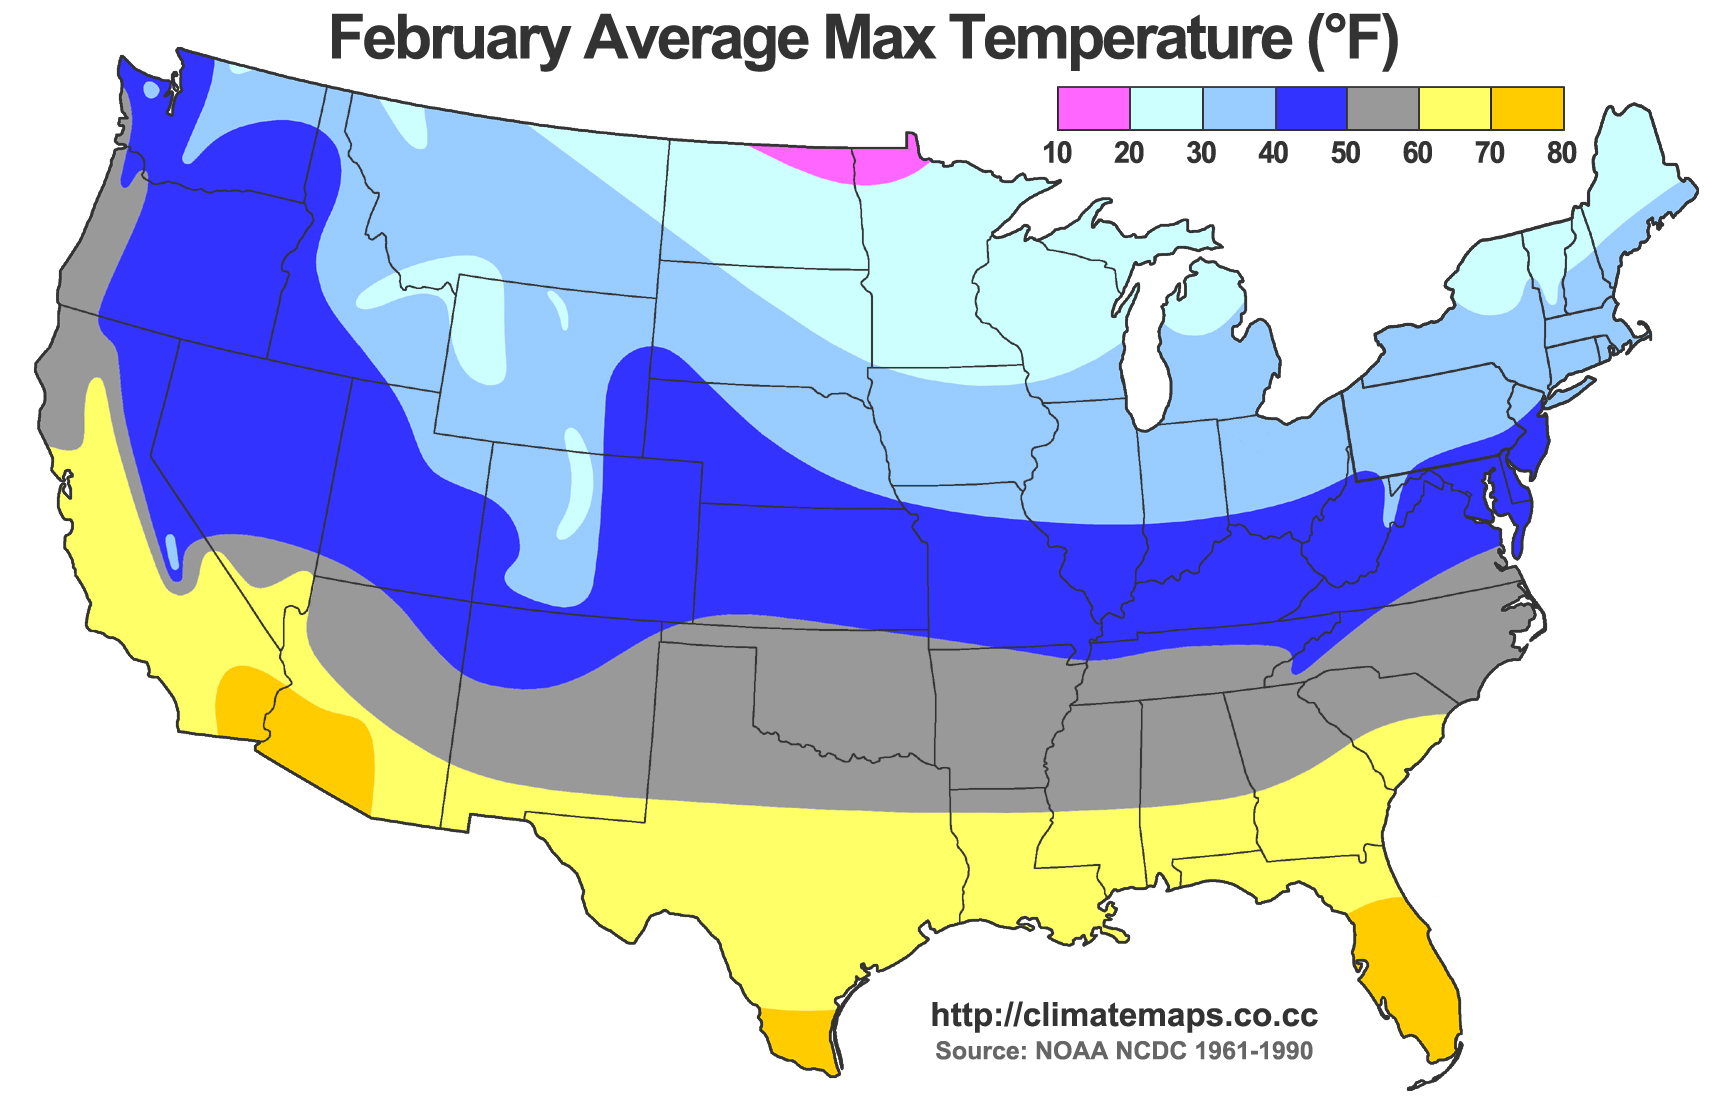
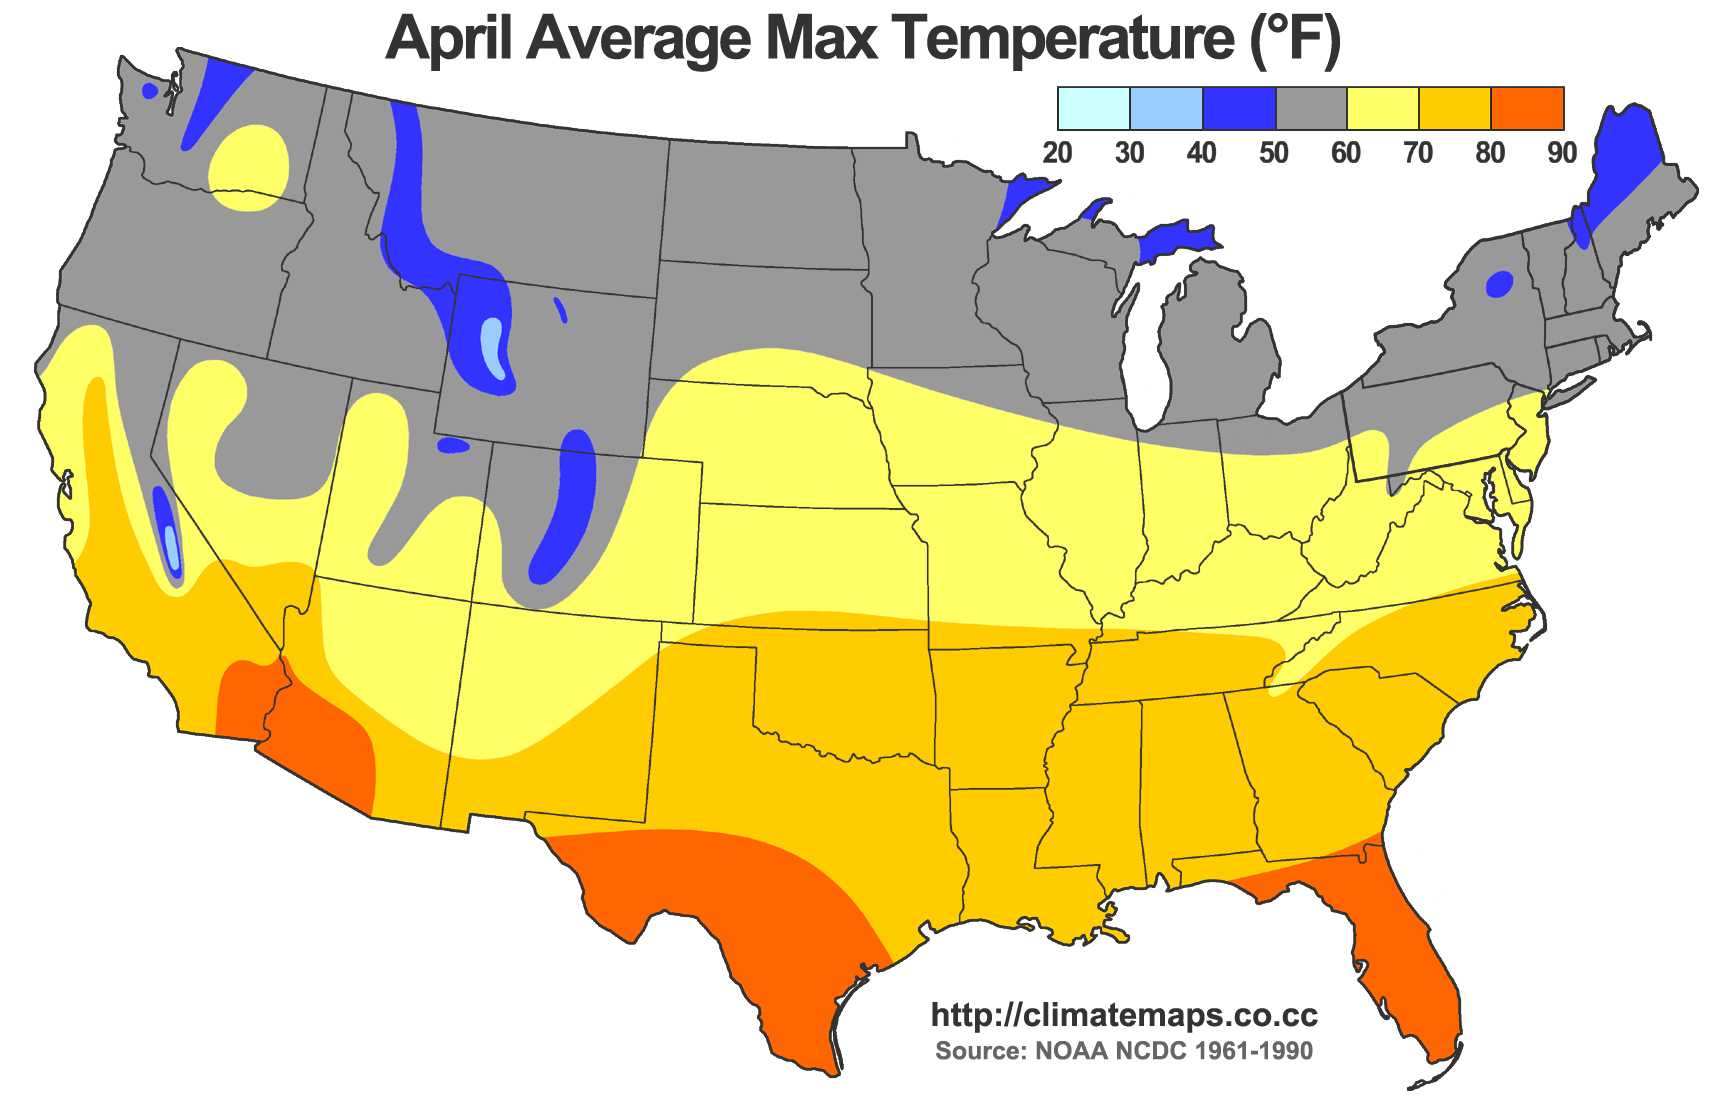
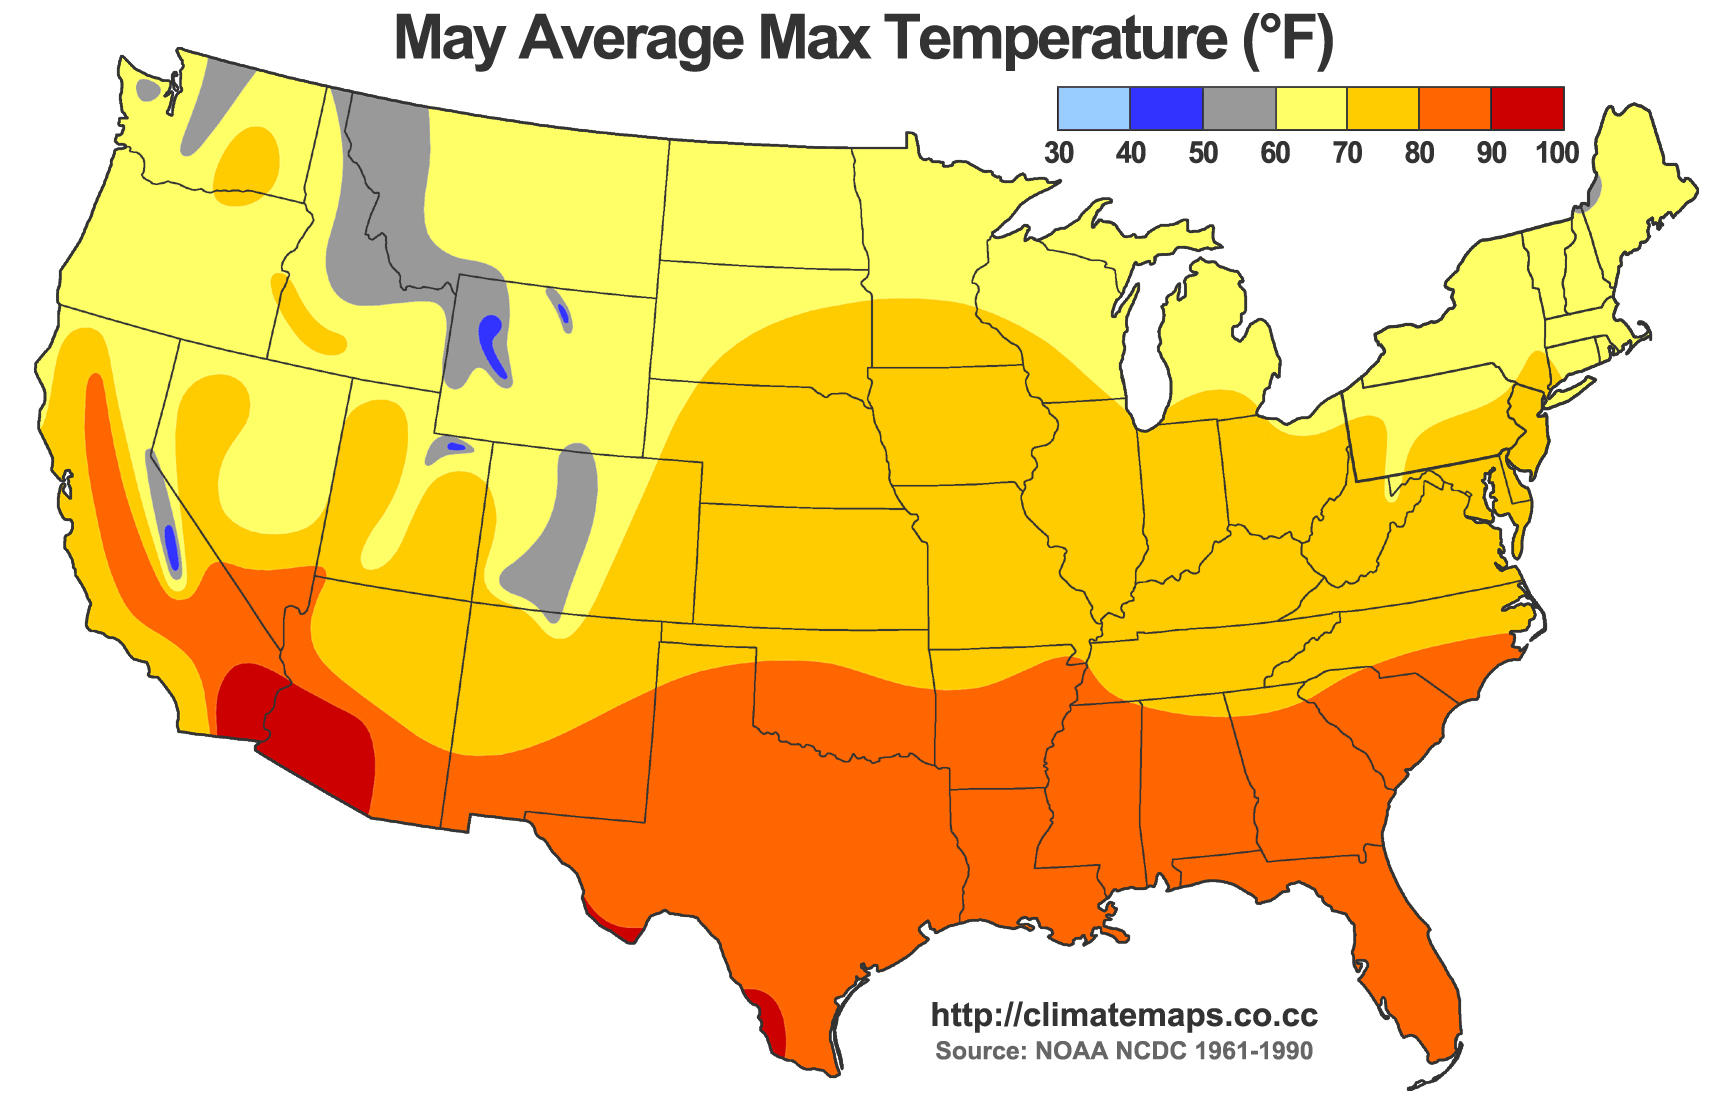
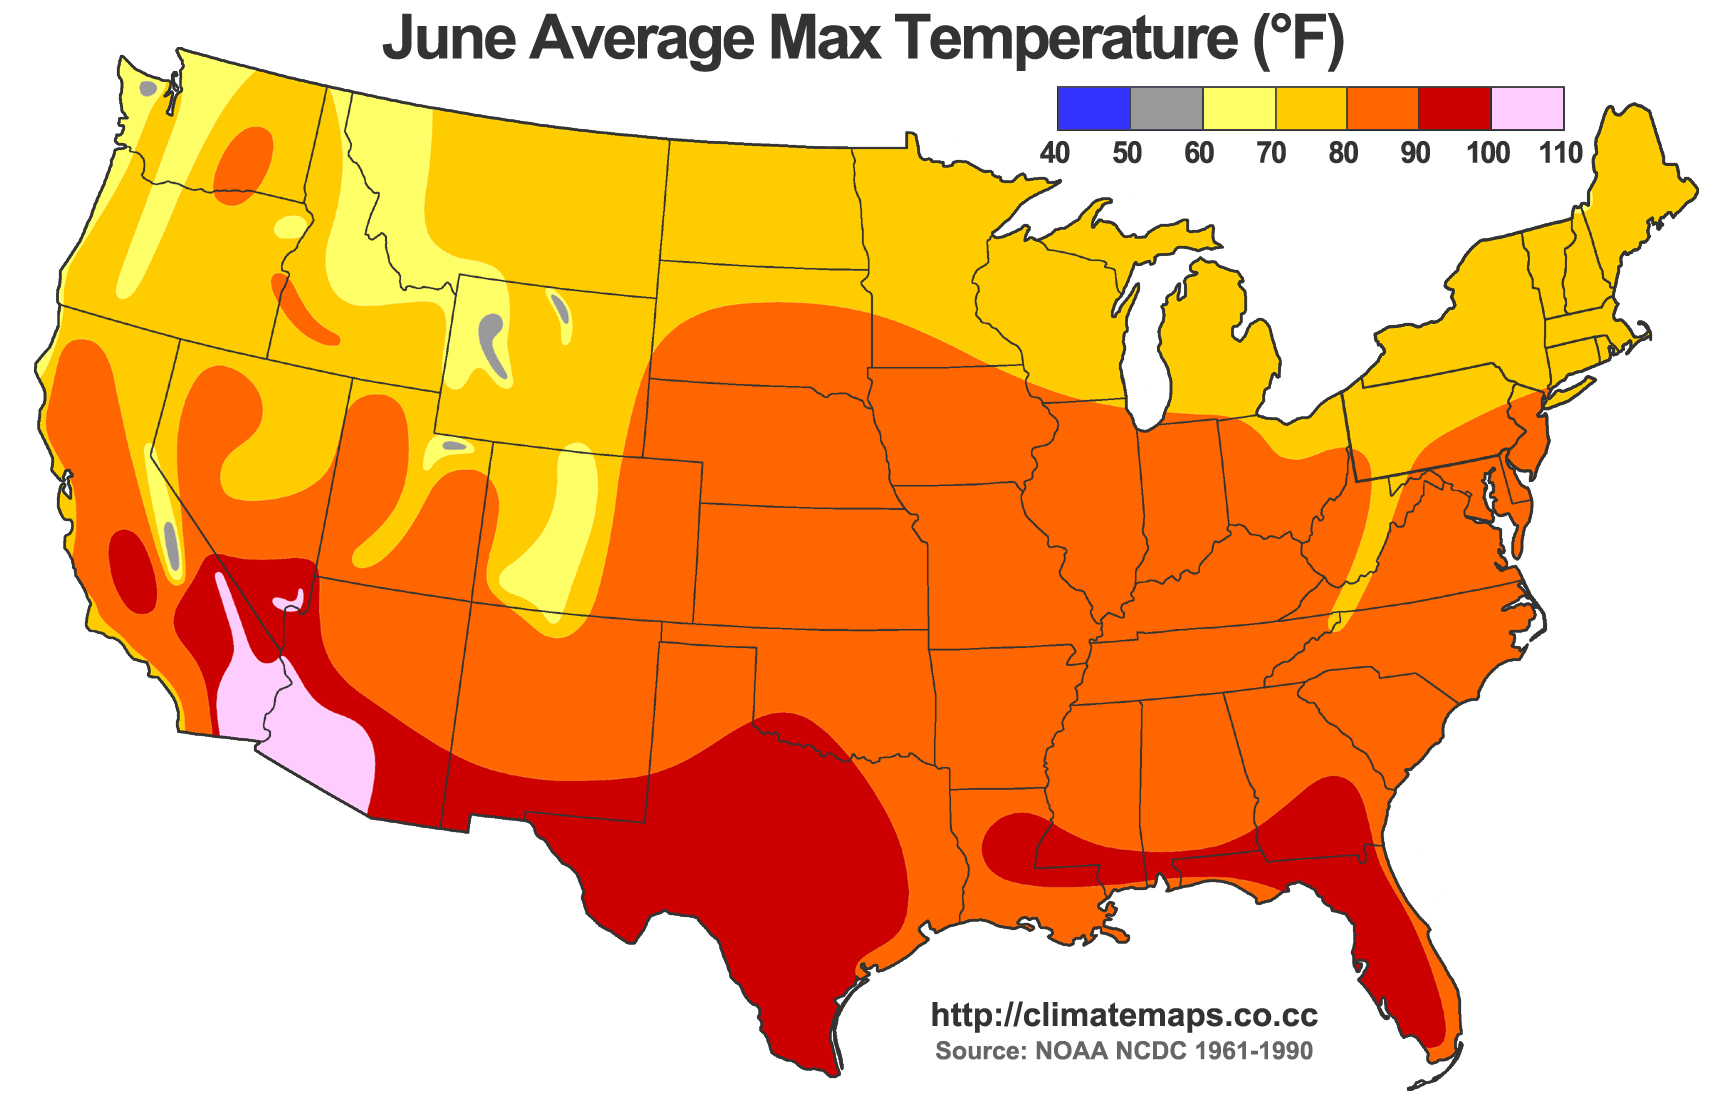
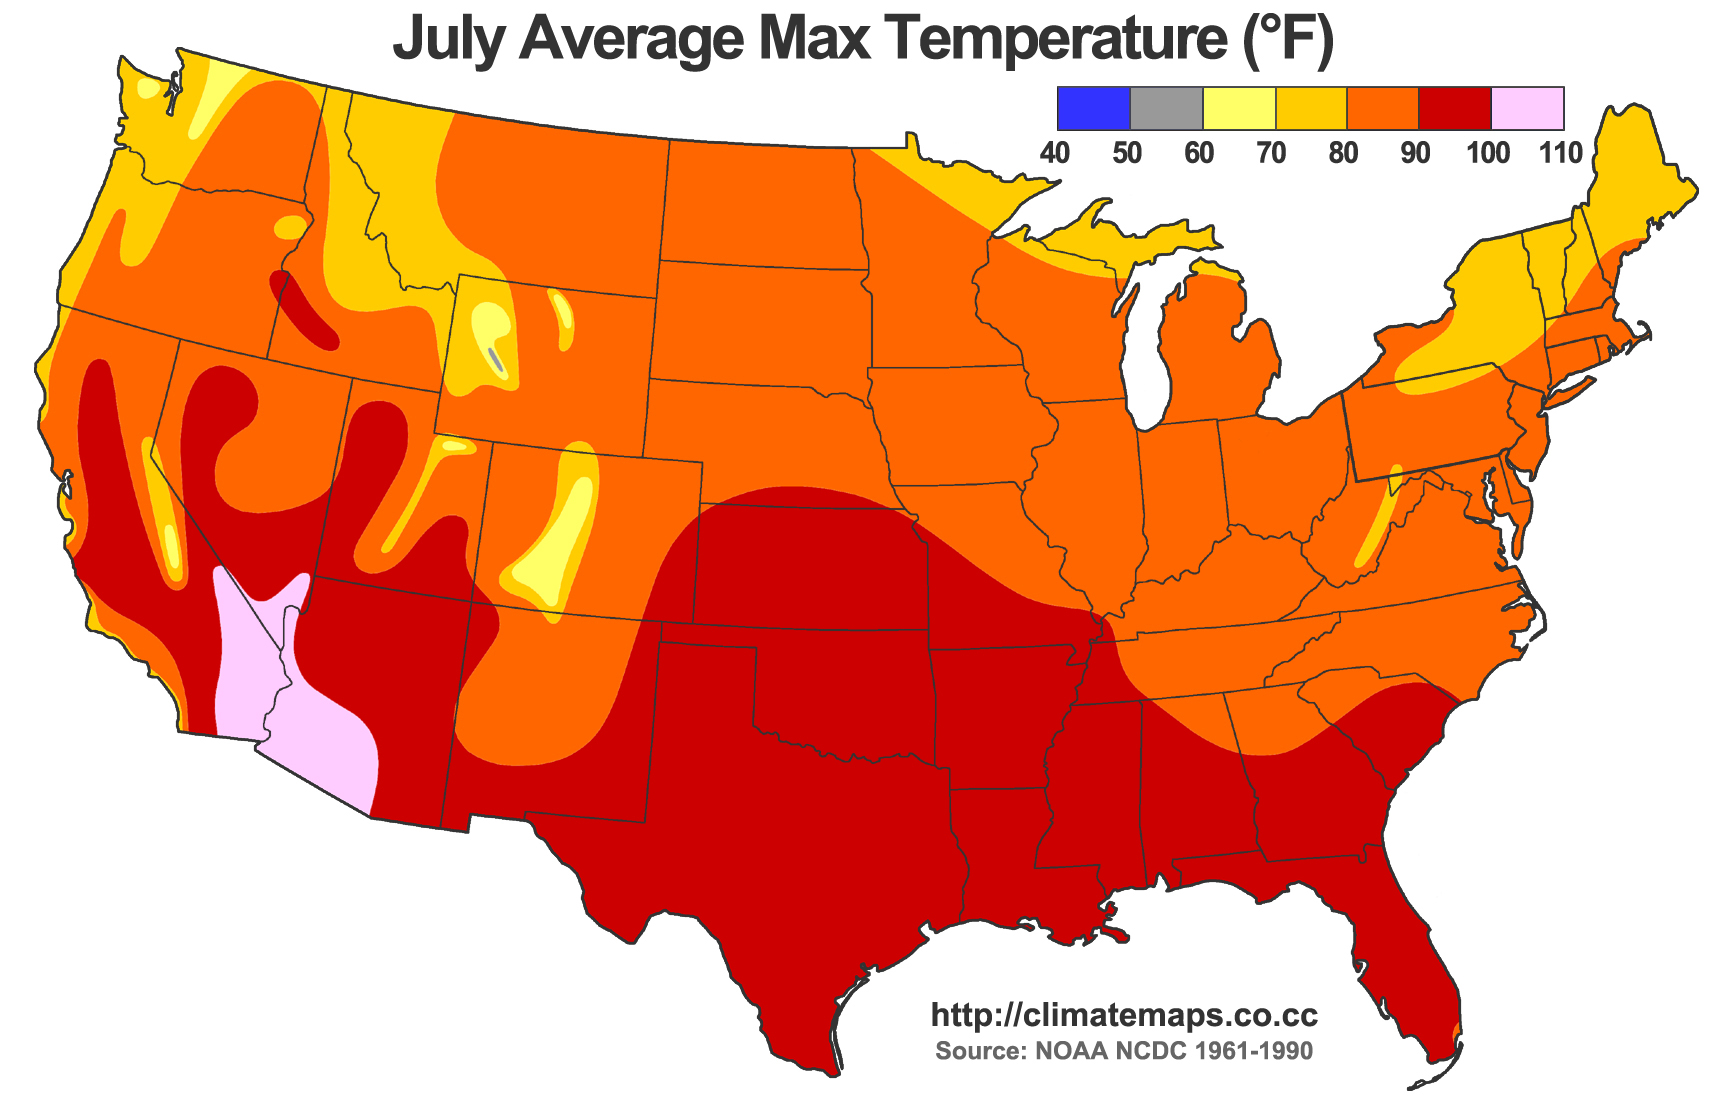
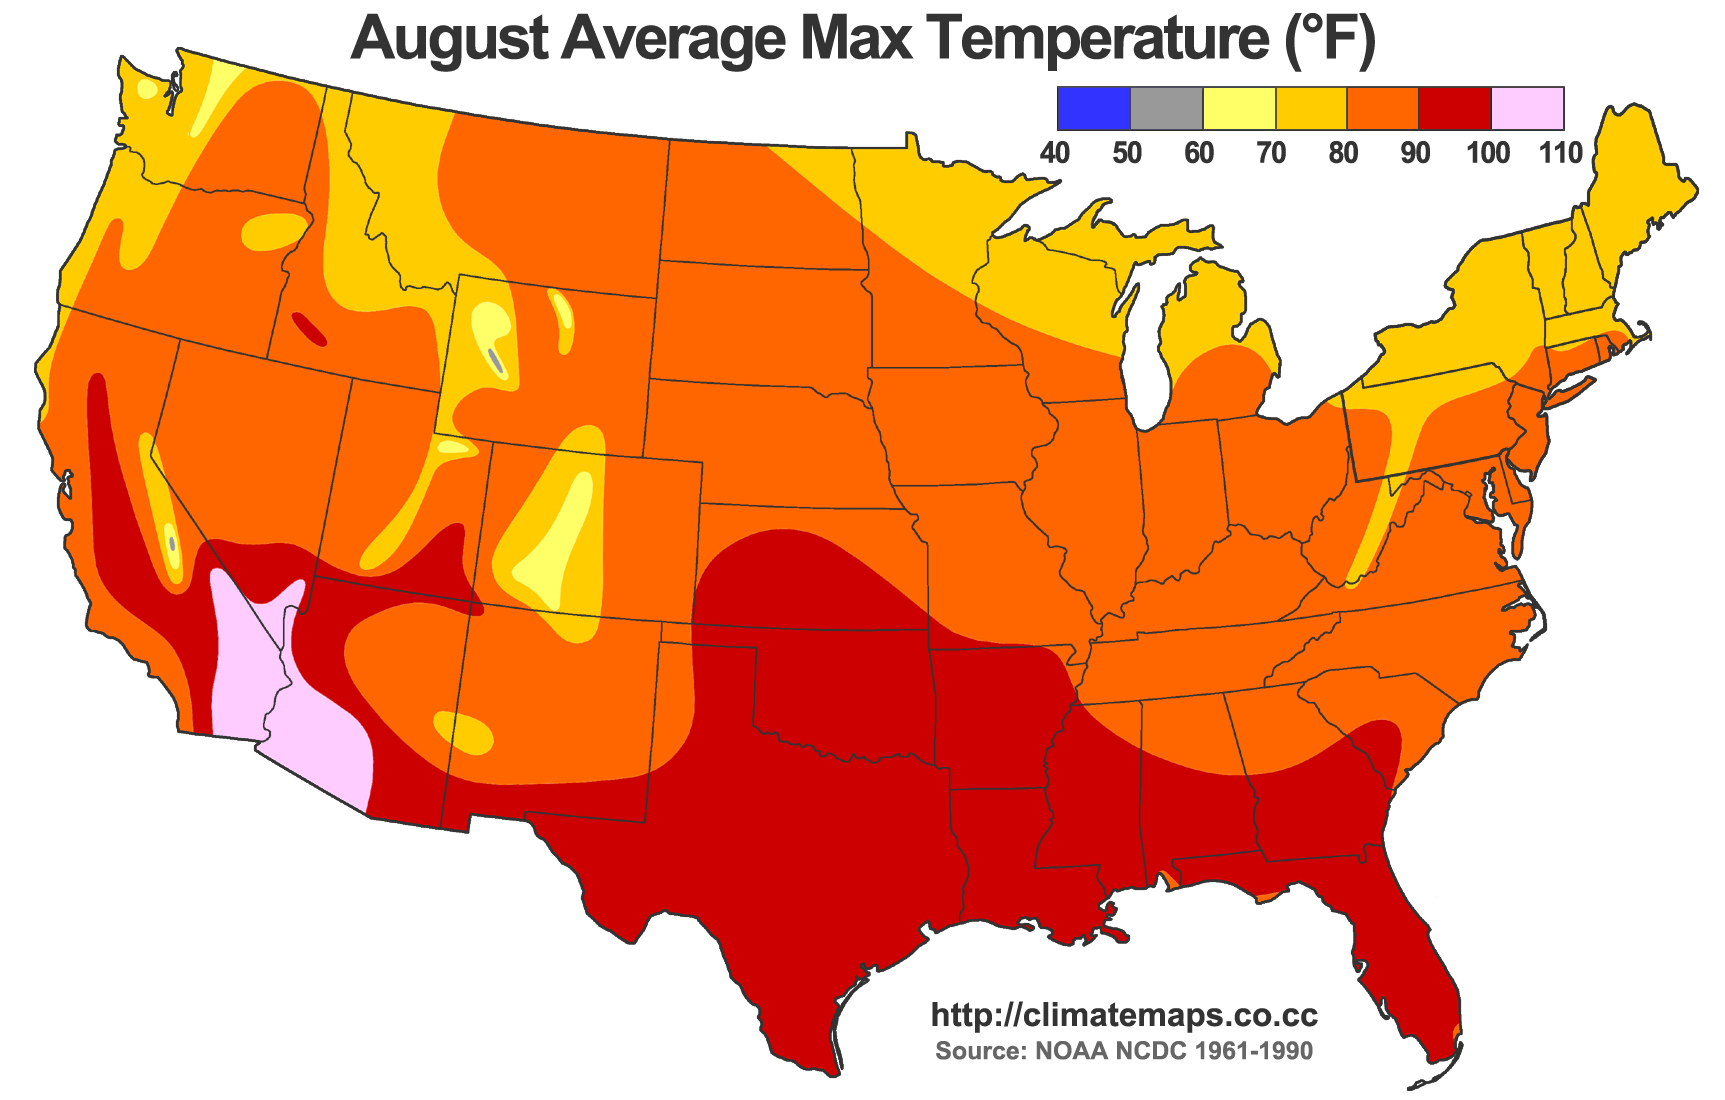
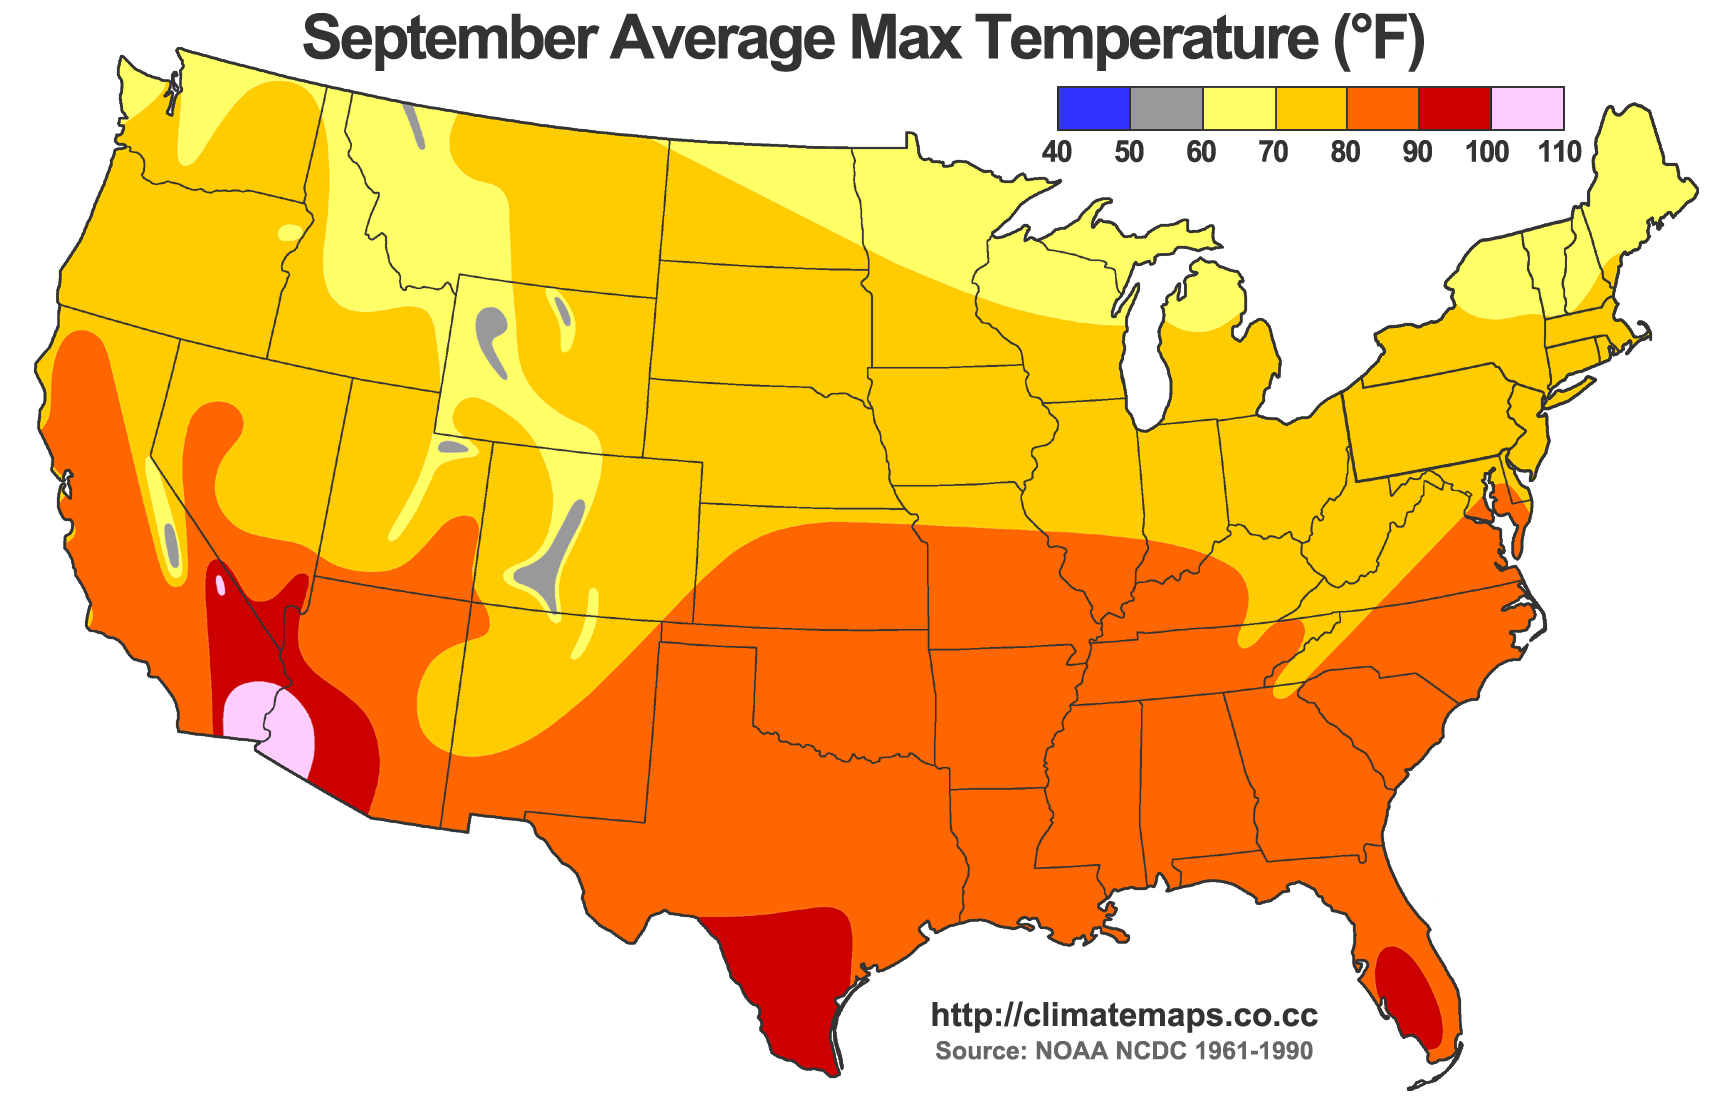
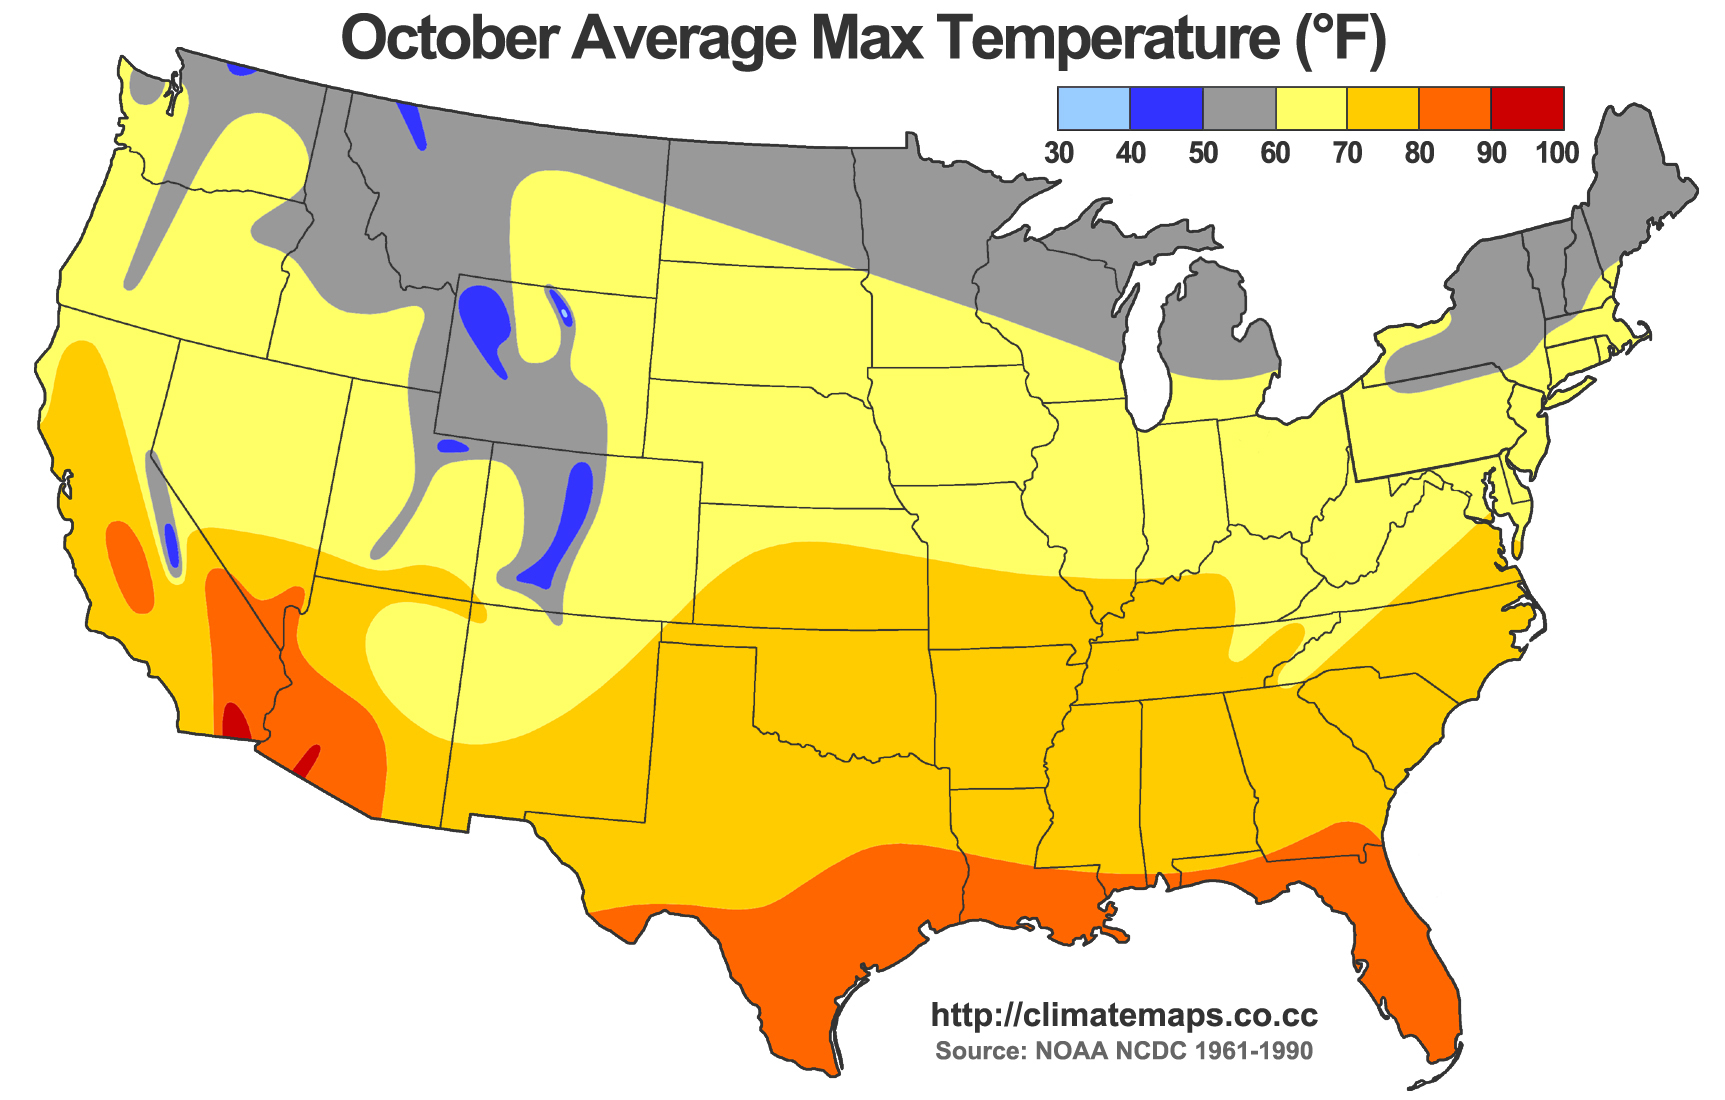
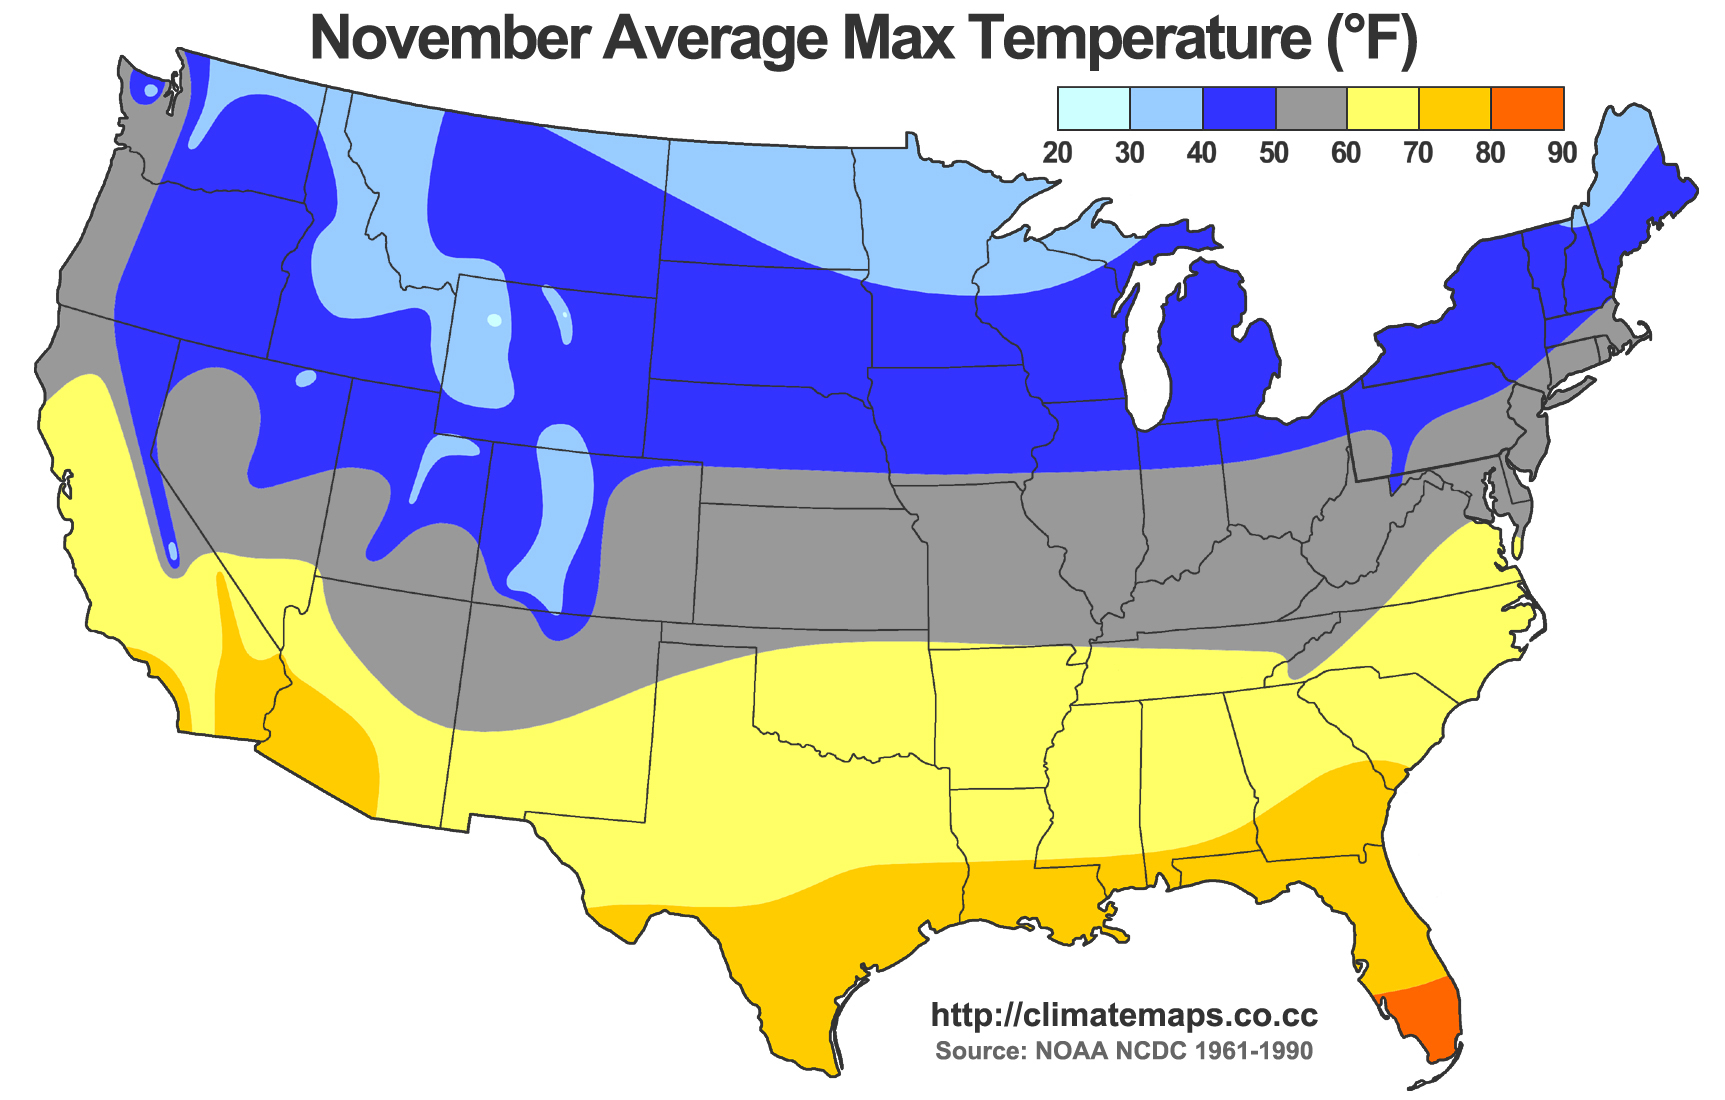
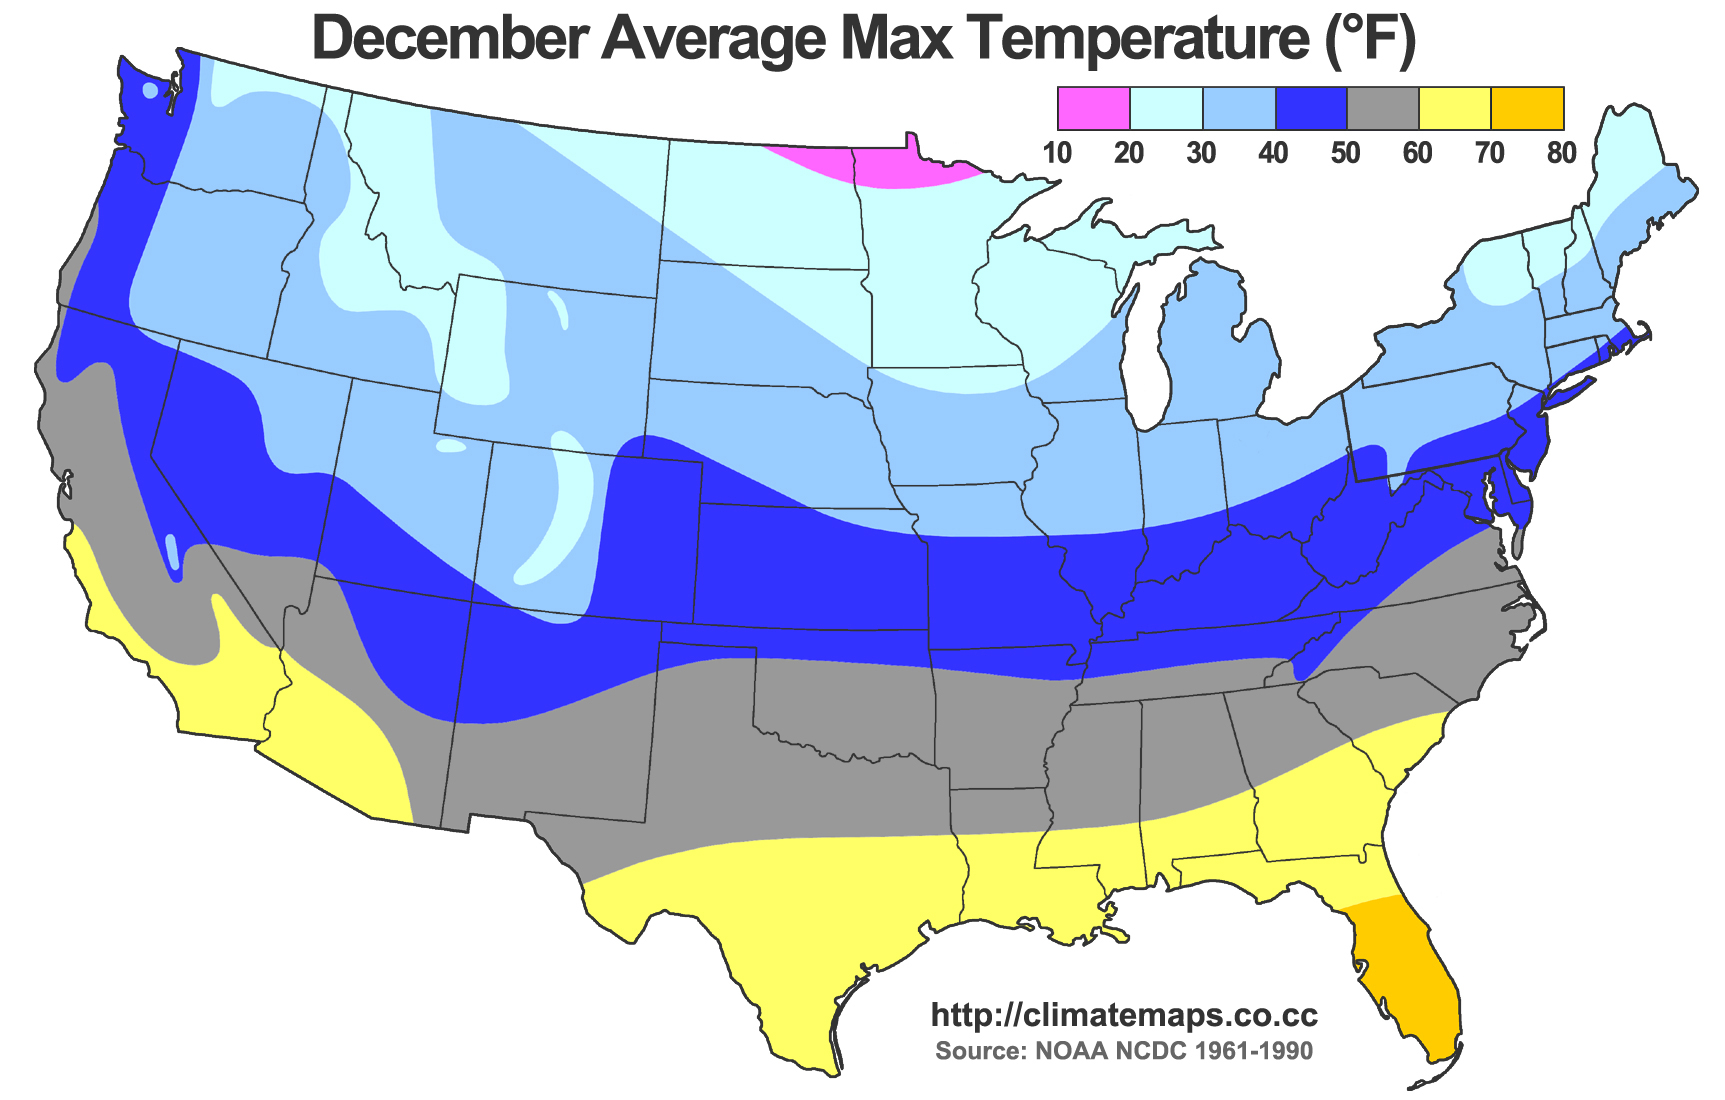
The NCDC produces a data product of U.S. 30-year climate normals. Released every ten years, the data are compiled from the previous three decades of daily weather observations from locations nationwide. Temperature normals are computed and serve as the 30-year baseline average. The results from one such dataset, the 1961-1990 climate normals, are shown below for monthly average high temperatures across the continental United States.
Climate maps were produced from this dataset for a variety of climate variables, including average high temperatures, low temperatures, precipitation, snowfall, and cloud cover. Additionally, a map of average tornado report density was generated using data from NOAA Storm Prediction Center's 1950-1995 tornado records. All data are displayed for annual and monthly averages. Maps are designed using simple design elements to improve clarity and readability.
For additional climate maps, go to http://sun.aos.wisc.edu/climatemaps

CloudSat QuickLooks
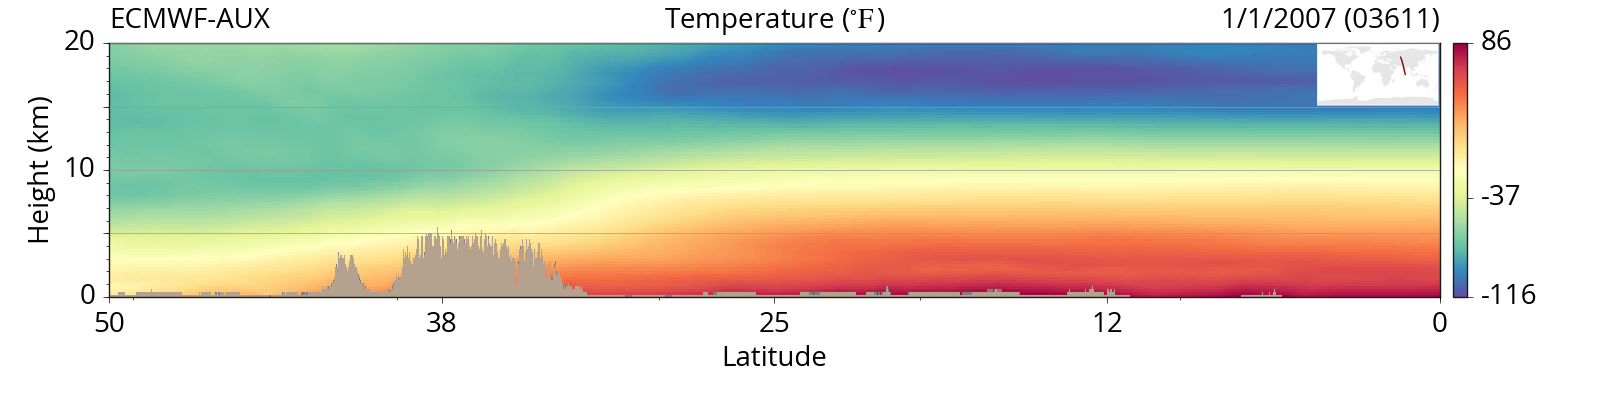
Active remote sensing from satellites provides unprecedented views of clouds and aerosols in the atmosphere. Knowledge of the vertical structure in the atmosphere helps inform our understanding of weather and climate on regional and global scales.
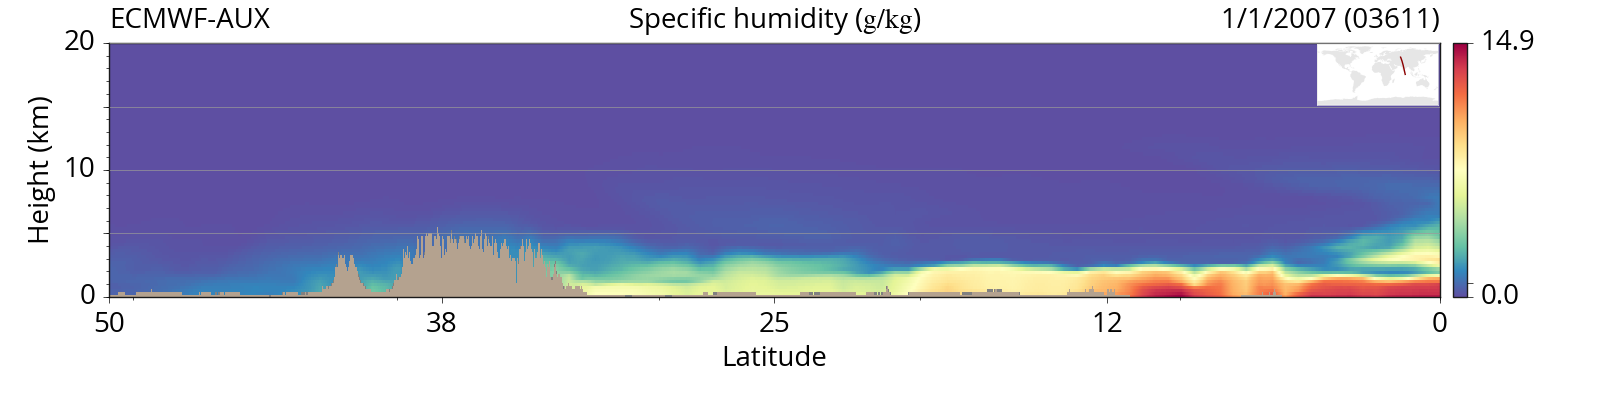
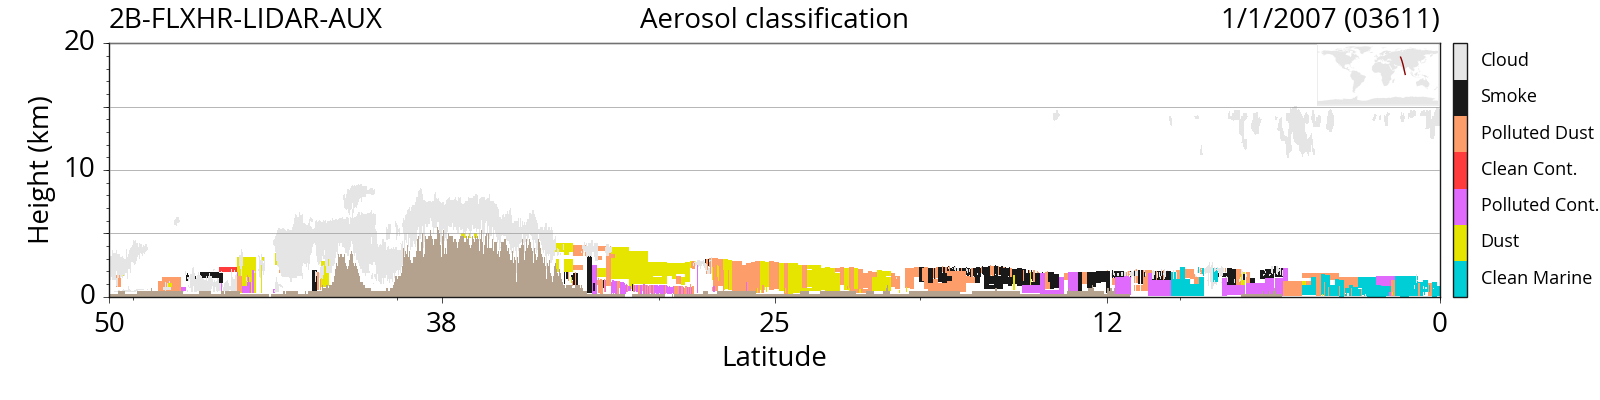
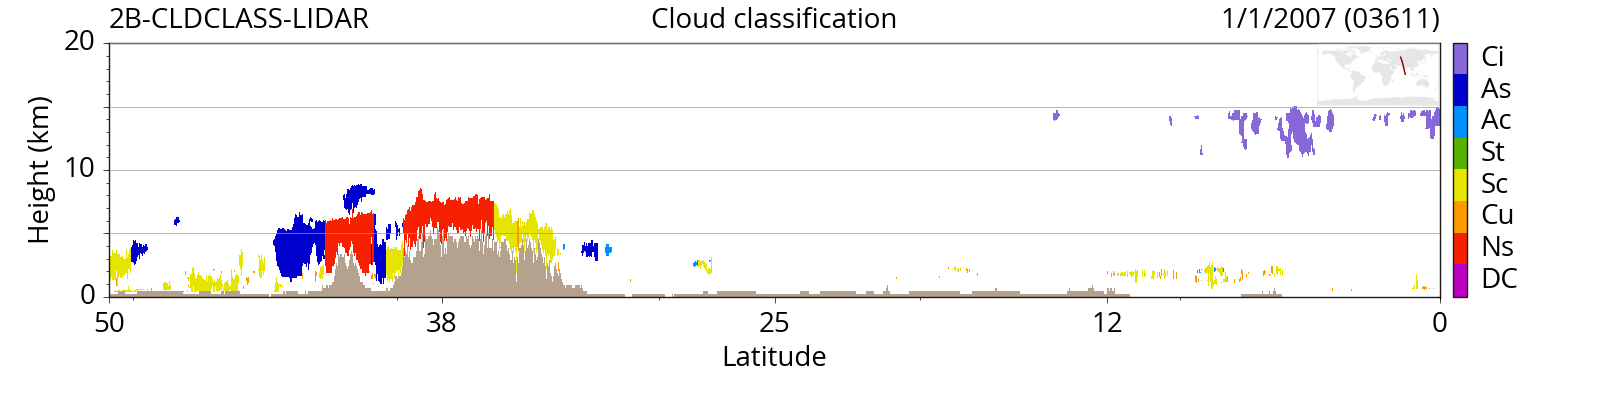
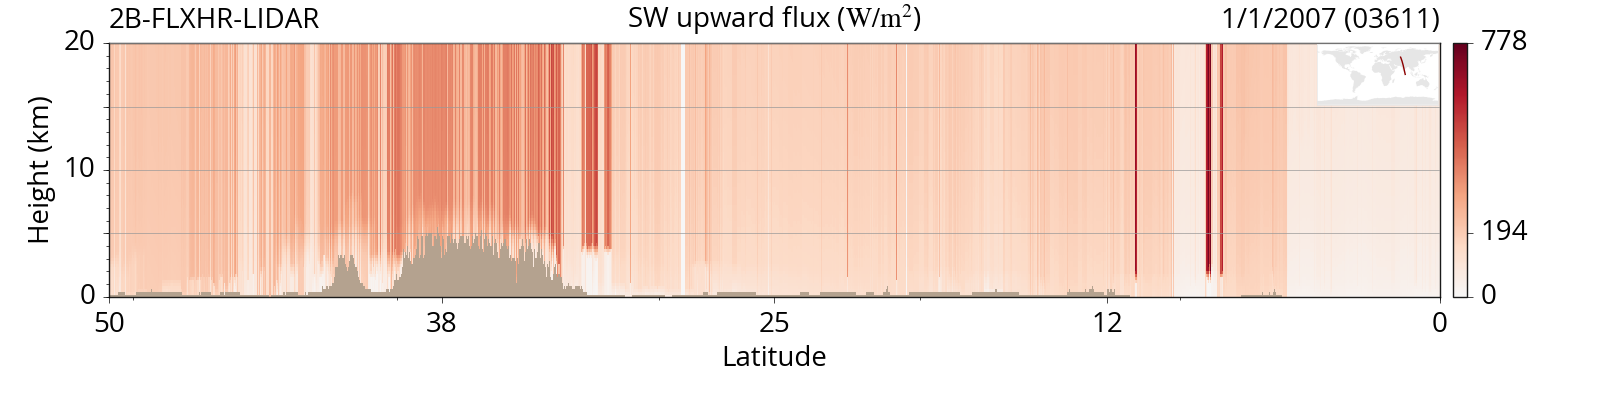
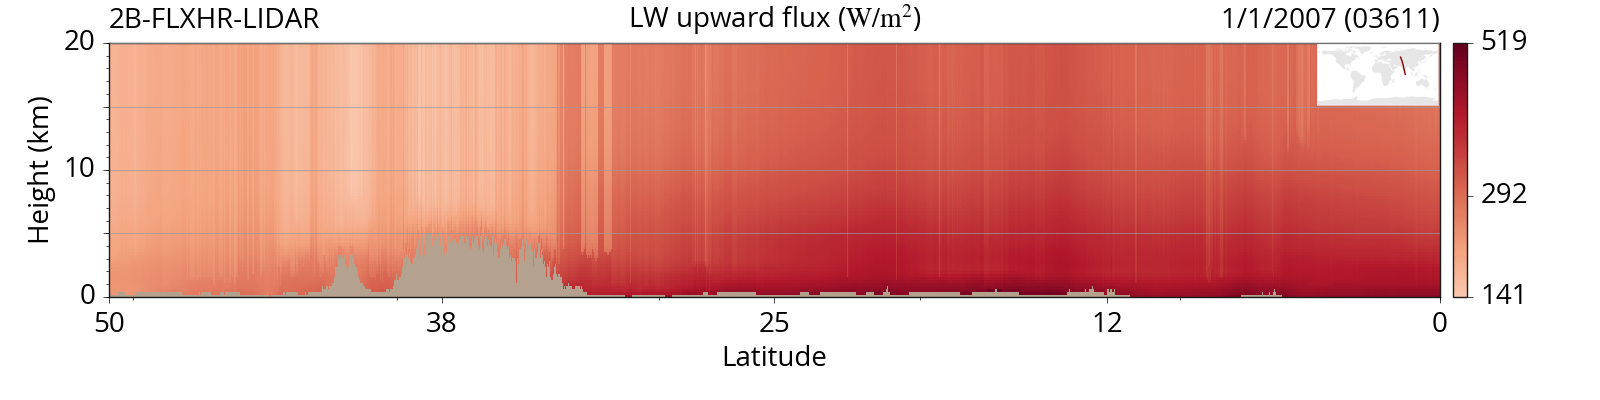
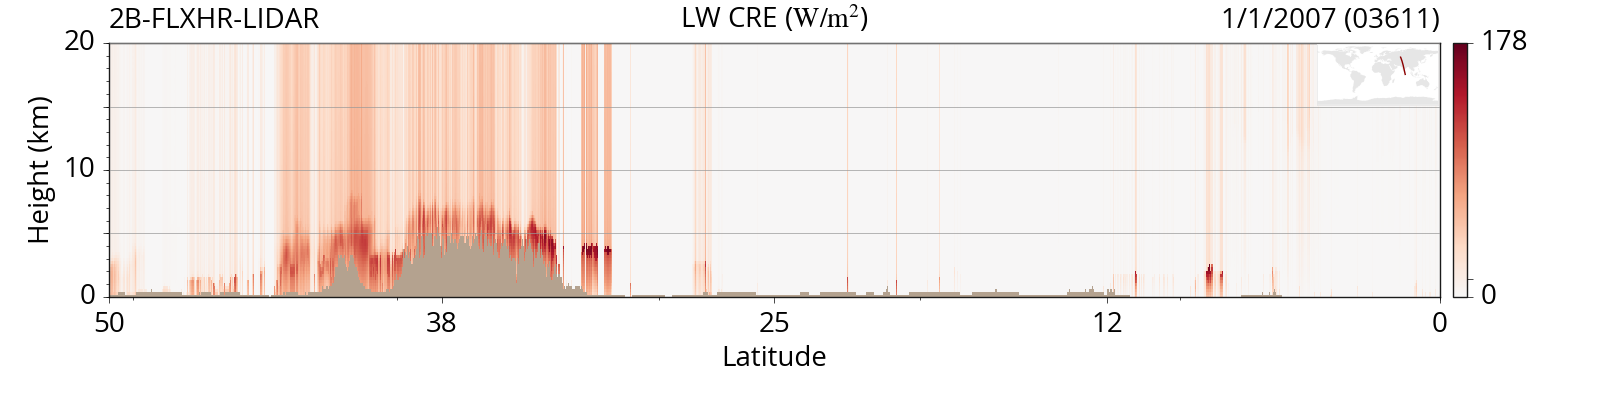
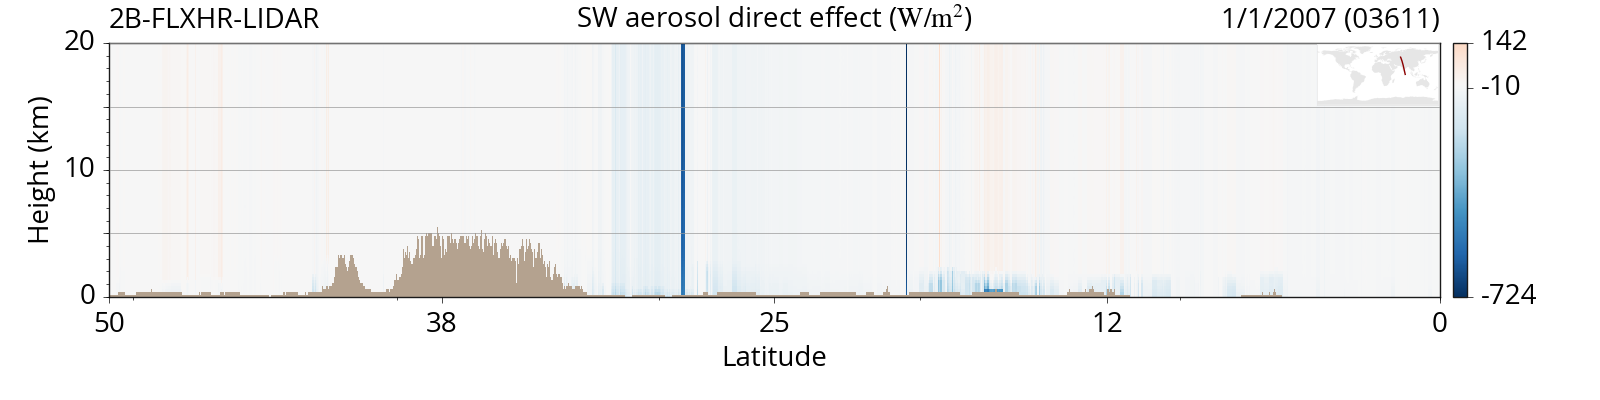
CloudSat and CALIPSO are two satellites which fly in formation and provide complementary measurements of atmospheric properties over the entire planet. CloudSat contains a radar highly sensitive to cloud droplets, while CALIPSO features a lidar which is better at detecting aerosols. Together, both instruments provide a more complete picture of what is in the atmosphere. Satellite observations from CloudSat and CALIPSO, as well as ECMWF model reanalysis data, are combined to create data products like the ones shown below.
Since satellite data is notoriously difficult to read and plot, I have developed a webpage to easily generate profiles of CloudSat satellite data. The CloudSat QuickLooks allow users to browse through many available datasets, including profiles of cloud, aerosol, precipitation, radiative fluxes, heating rates, temperature, humidity, and ozone. Feel free to click the link below to get started.
For more CloudSat QuickLooks, go to http://sun.aos.wisc.edu/plot
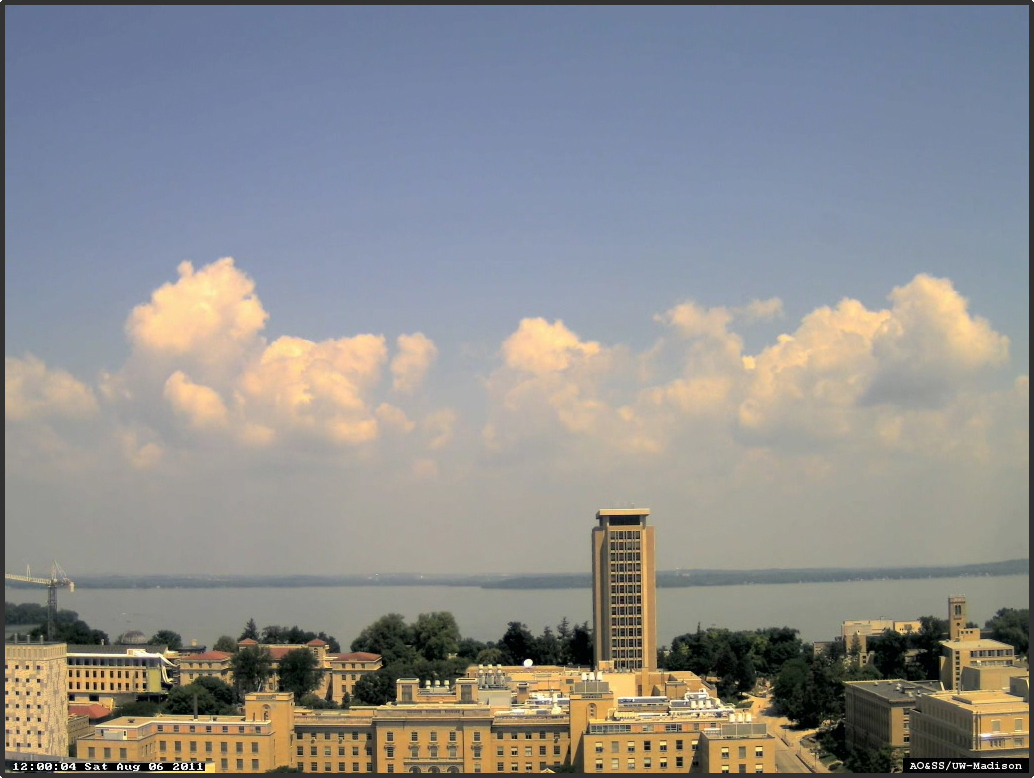
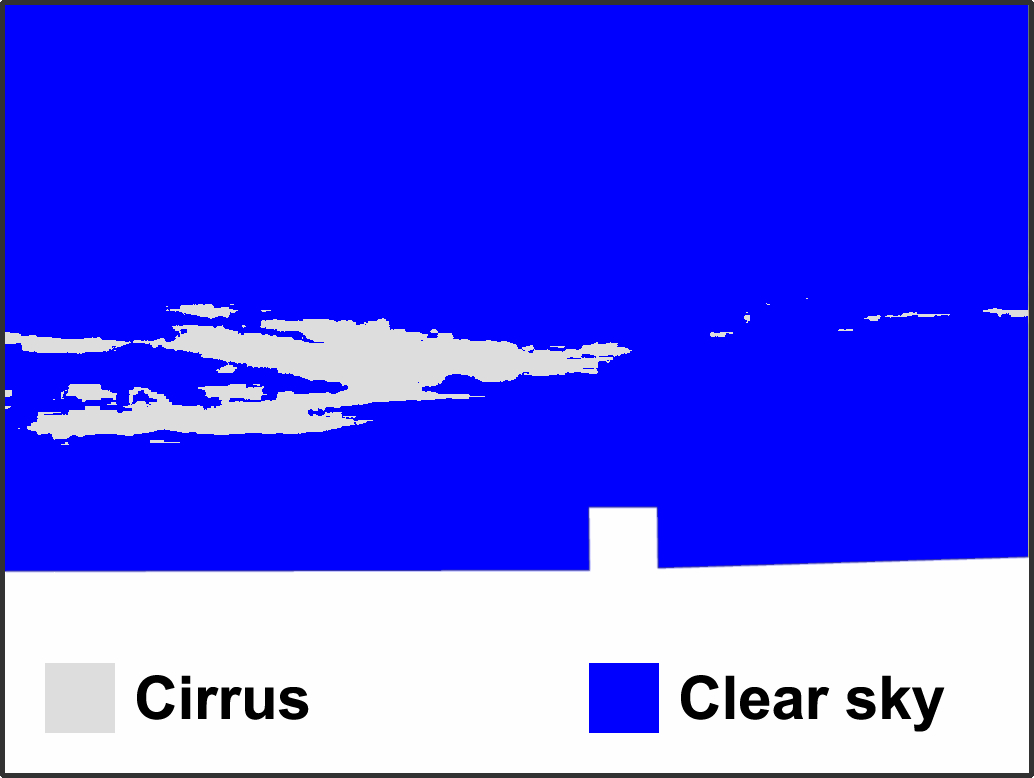
Automated Cloud Classification
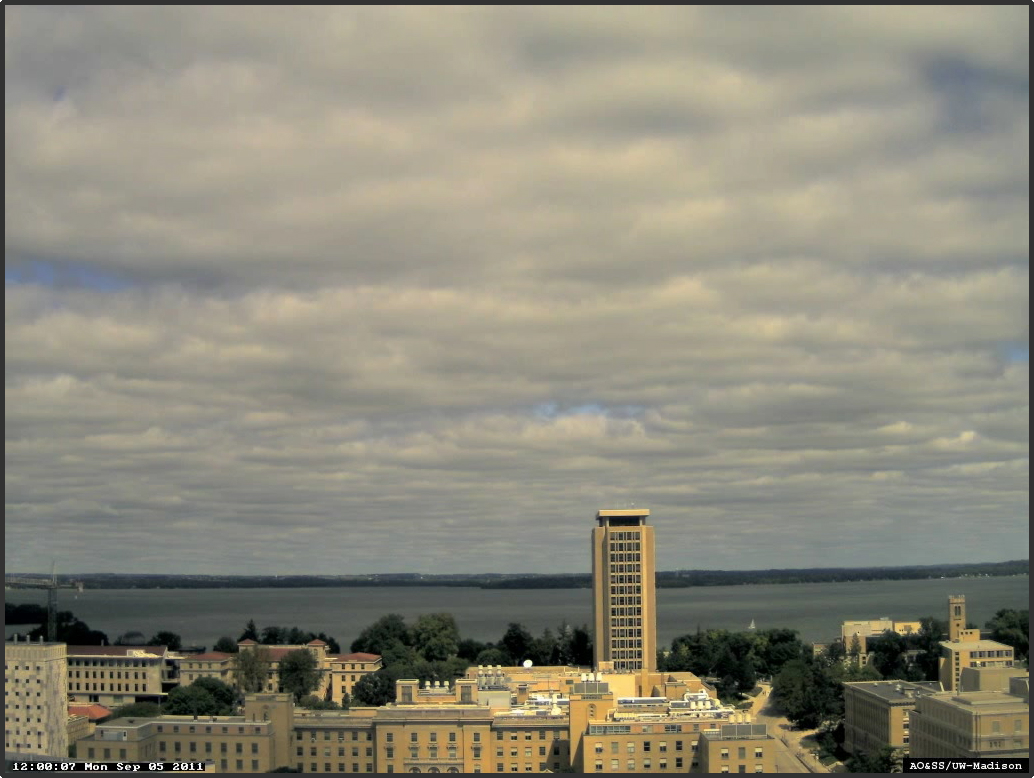
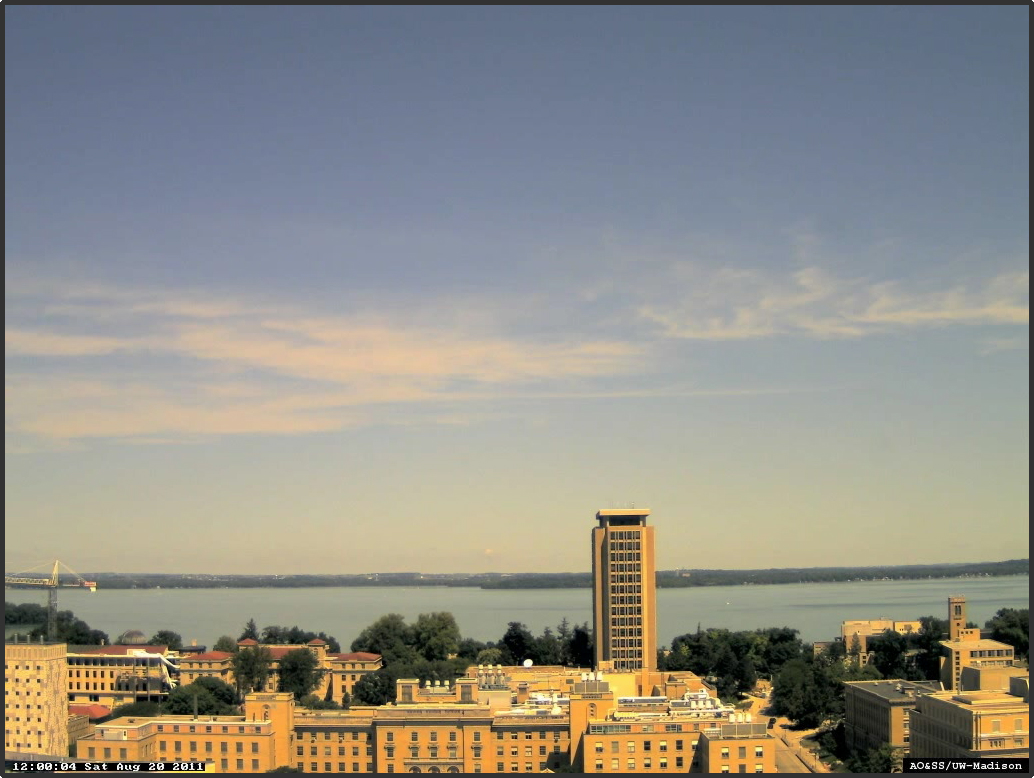
Outdoor webcams provide a near-continuous dataset of weather observations. These observations can be used to classify cloud type (i.e. cumulus, stratus, cirrus). Cloud type tells us about microphysical properties of clouds that are difficult to detect from radar or satellite-based measurements.
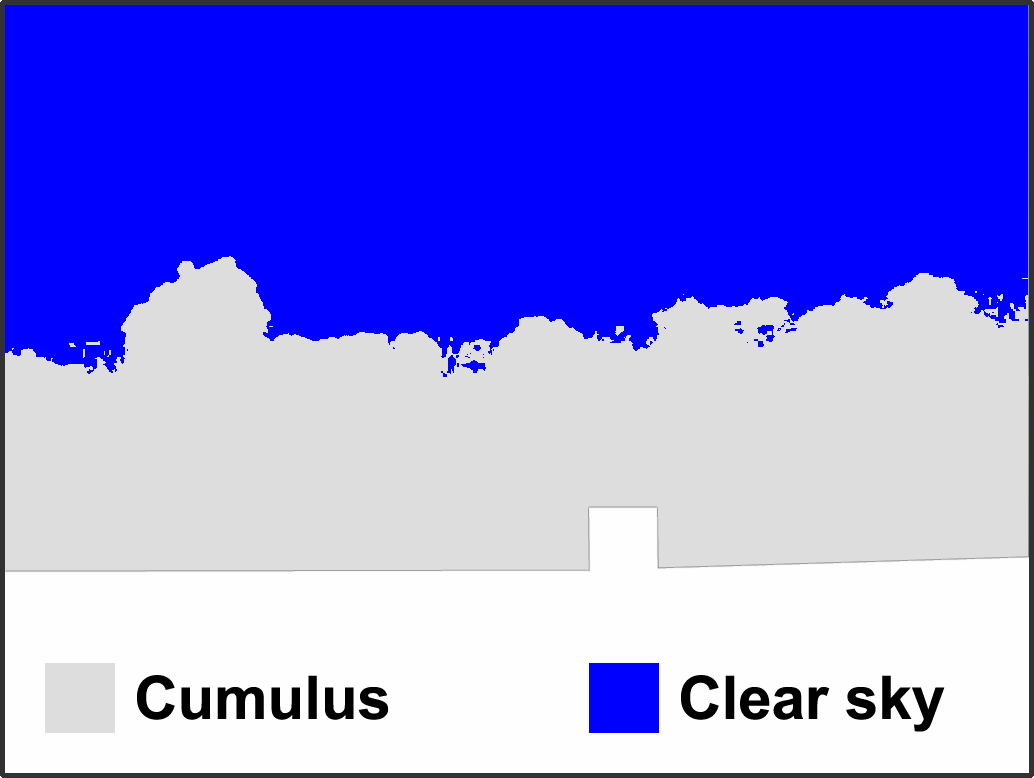
Three high resolution cameras capture images atop the Atmospheric, Oceanic, and Space Sciences (AO&SS) building at the UW-Madison. Based on RGB pixel values, a classification algorithm is used to determine cloud type present in each image.
This algorithm provides a simple way to classify clouds from a digital webcam. Improvements to this algorithm will enable digital cameras to be used to classify various cloud types to provide insight into important microphysical and radiative properties. A vast network of live webcams currently exists in the United States. Automatic cloud classification from webcams has the potential to provide a cost effective means of sky observations in remote areas.