Research
Aerosol Direct Radiative Effects
Atmospheric aerosols - airborne liquid and/or solid particles - are a critical source of uncertainty in climate science. Aerosols can change Earth's radiation balance by scattering and absorbing sunlight. Whereas most aerosols scatter sunlight which cools the atmosphere, some aerosols (including soot and dust) absorb sunlight which warms the atmosphere.
The behavior of aerosols affects the world around us every day. For example, the scattering properties of aerosols can make a hazy sky appear brighter than a clear sky. Since much of the sunlight is scattered back to space, aerosols can greatly reduce the intensity of sunlight reaching the surface. In heavily polluted areas, aerosols can reduce sunlight reaching the surface by over ten percent.
The changes in solar radiation due to the presence of aerosols are known as aerosol direct radiative effects. Global estimates of aerosol radiative direct effects may be obtained by combining multi-sensor satellite data including CloudSat, CALIPSO, and MODIS. The figures below display global mean aerosol radiative direct effects from 2006 through 2011. Results are presented at several height levels, including Earth's surface and the top of the atmosphere. Figures also display aerosol forcing due to atmospheric absorption (TOA minus SFC). As shown, the largest aerosol direct effects are found at locations near the source regions of the aerosols. Aerosols in climate present interesting radiative feedbacks that may be evaluated using a powerful tool known as radiative kernels described in greater detail HERE.
For more information about the CloudSat 2B-FLXHR-LIDAR product, please refer to the official documentation from the CloudSat Data Processing Center. A complete description of this work is provided in my PhD dissertation, "Aerosol direct radiative effects and heating in the new era of active satellite observations".
.png)
.png)
.png)
.png)
.png)
.png)
.png)
.png)
.png)
.png)
.png)
.png)
.png)
.png)
.png)
Liquid Water Path Algorithm
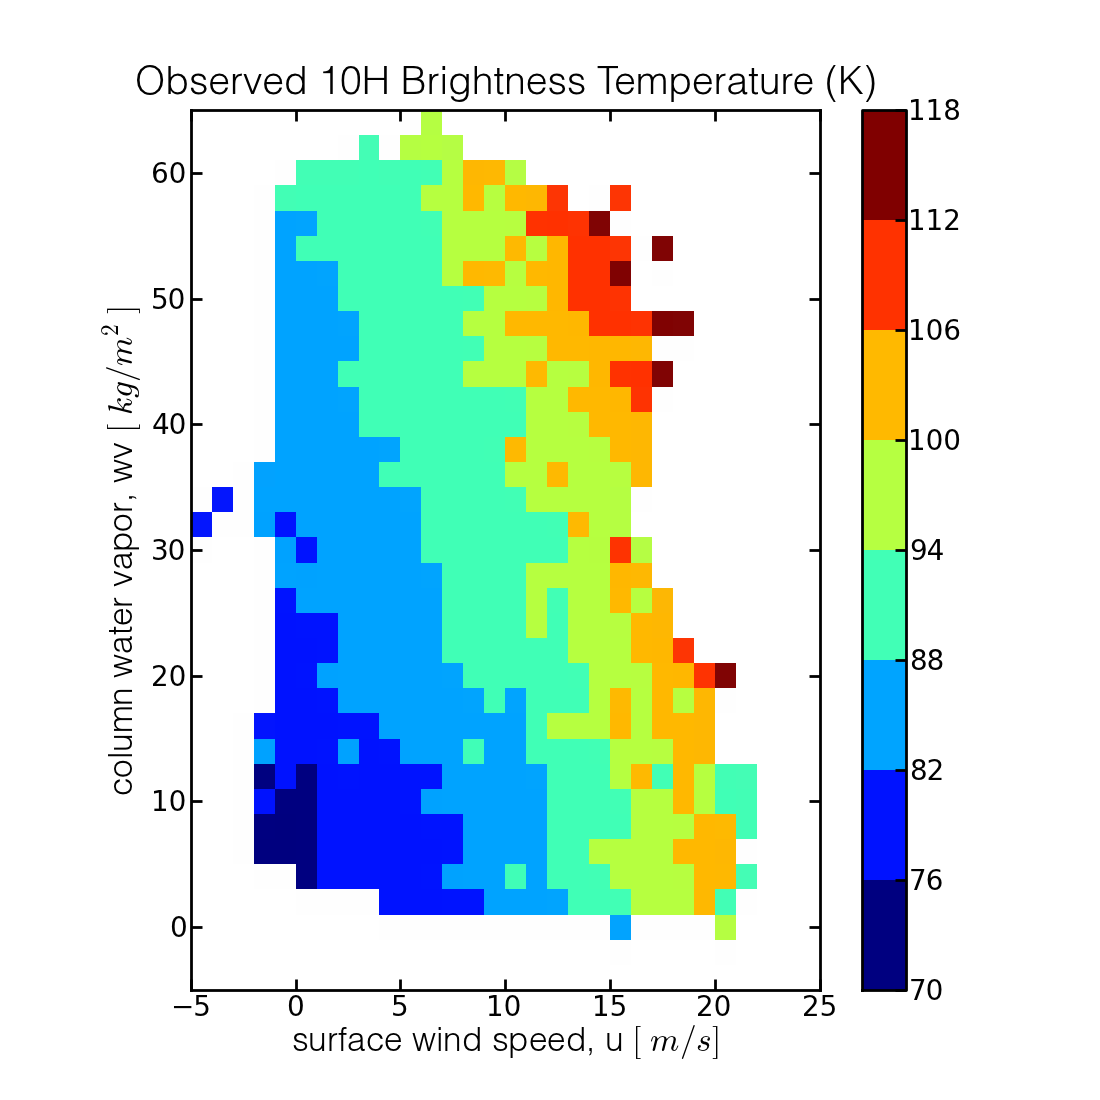
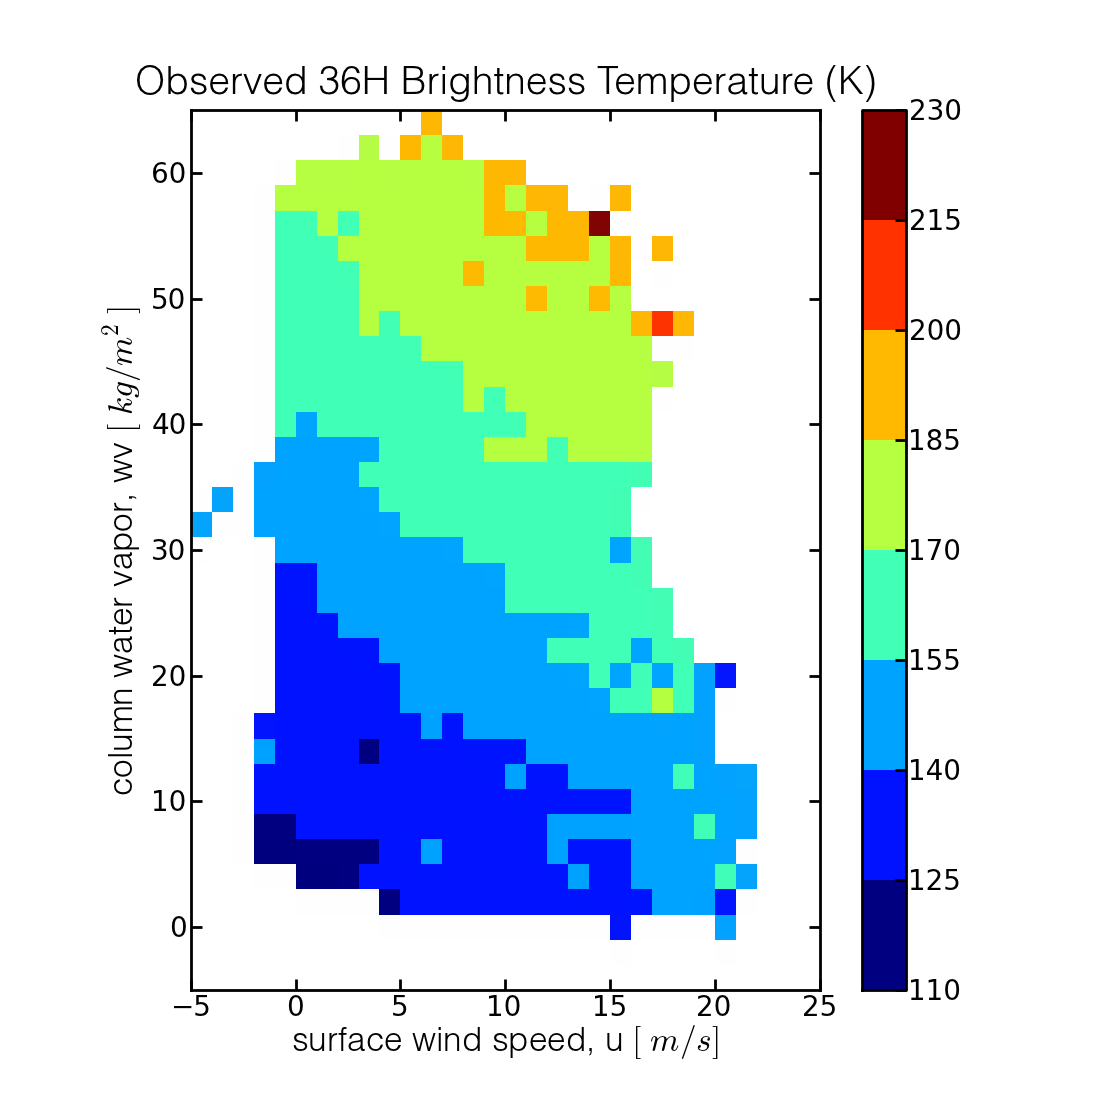
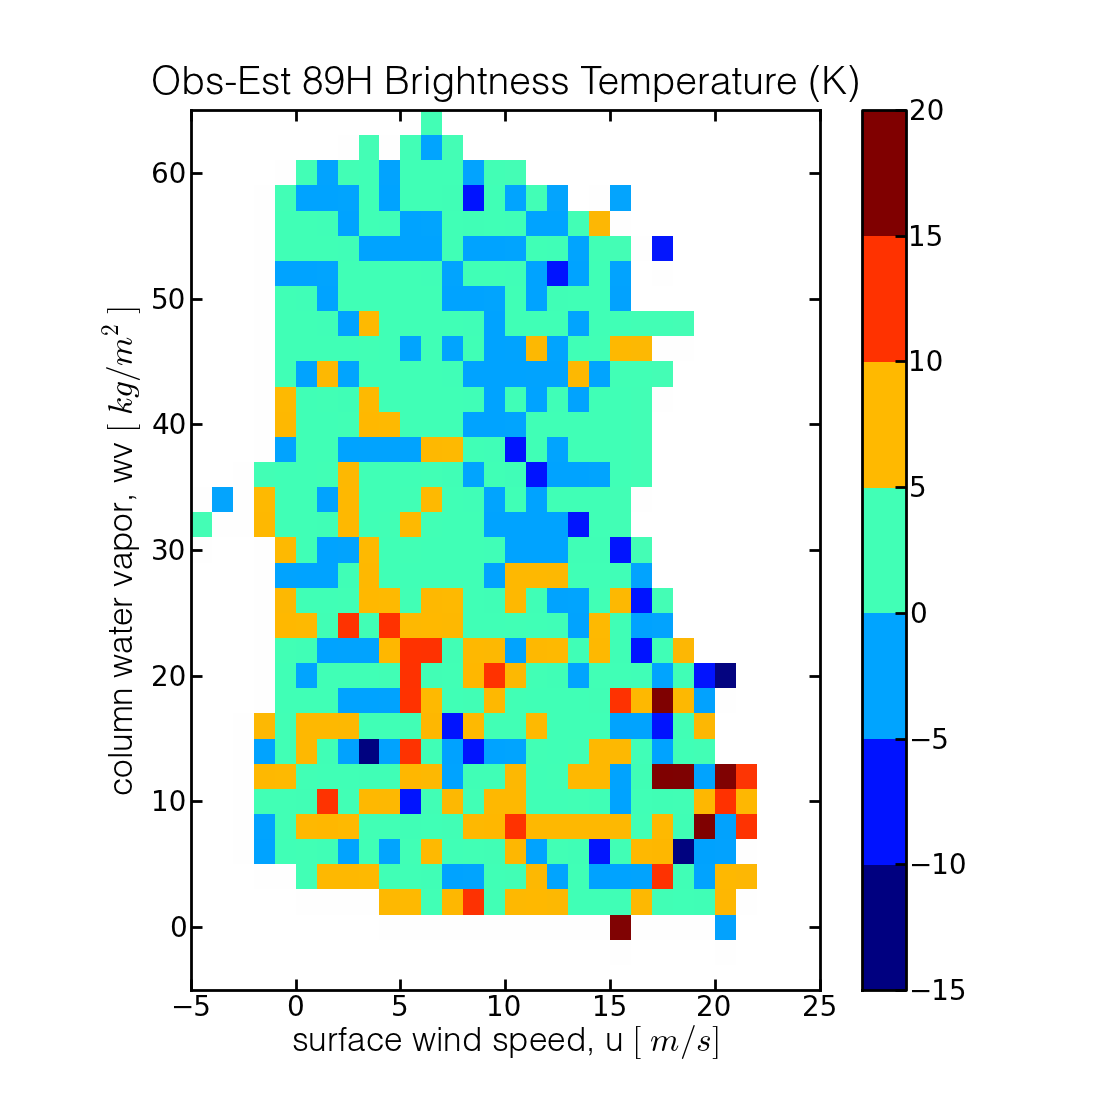
Satellite-borne microwave radiometers detect faint microwave emissions from Earth's surface and atmosphere, using a metric known as brightness temperature. From these measurements various geophysical parameters may be retrieved, such as column integrated liquid water path. These measurements provide valuable information about atmospheric conditions in locations otherwise poorly sampled by in-situ techniques.
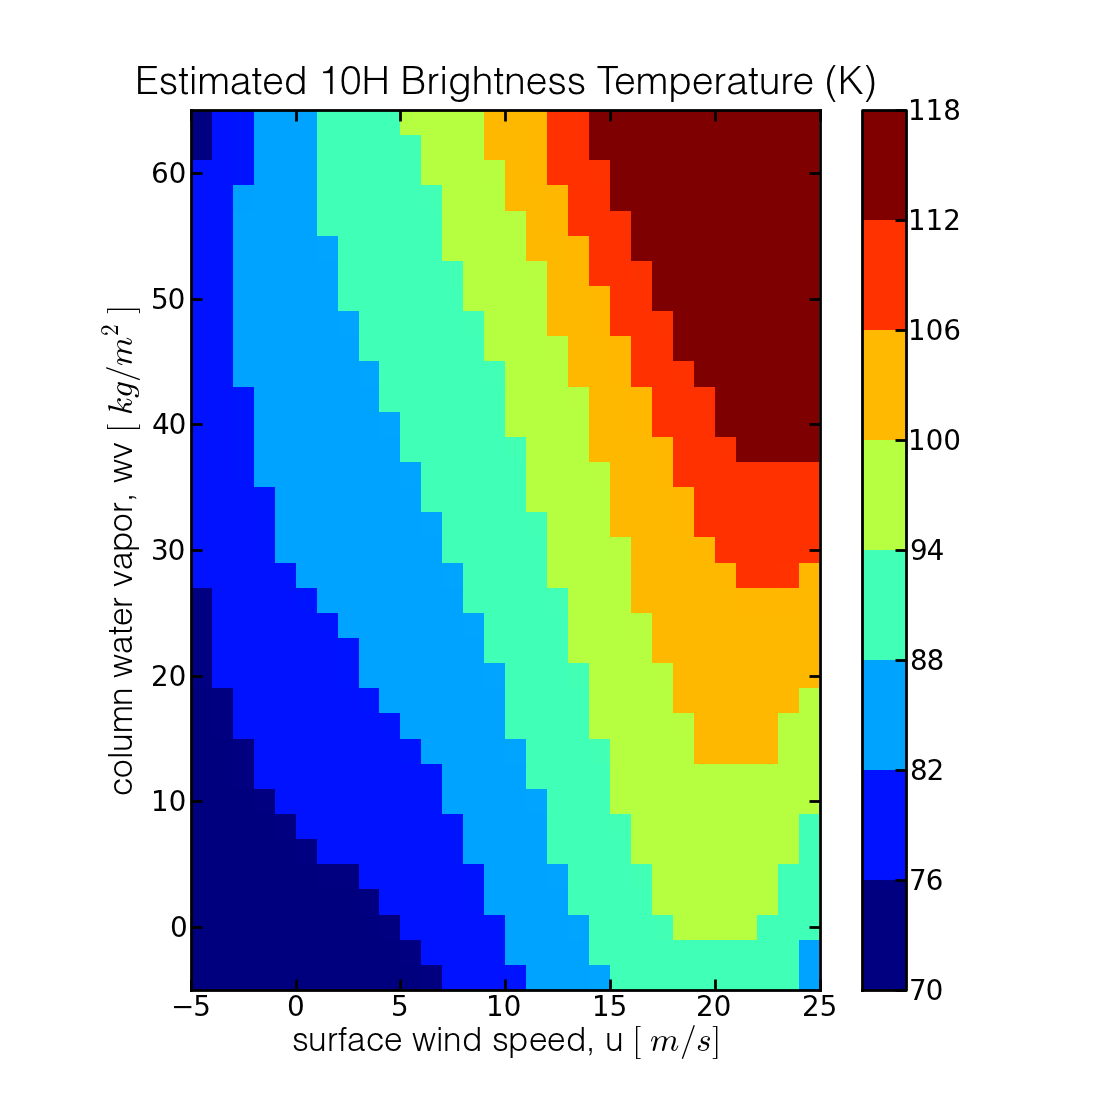
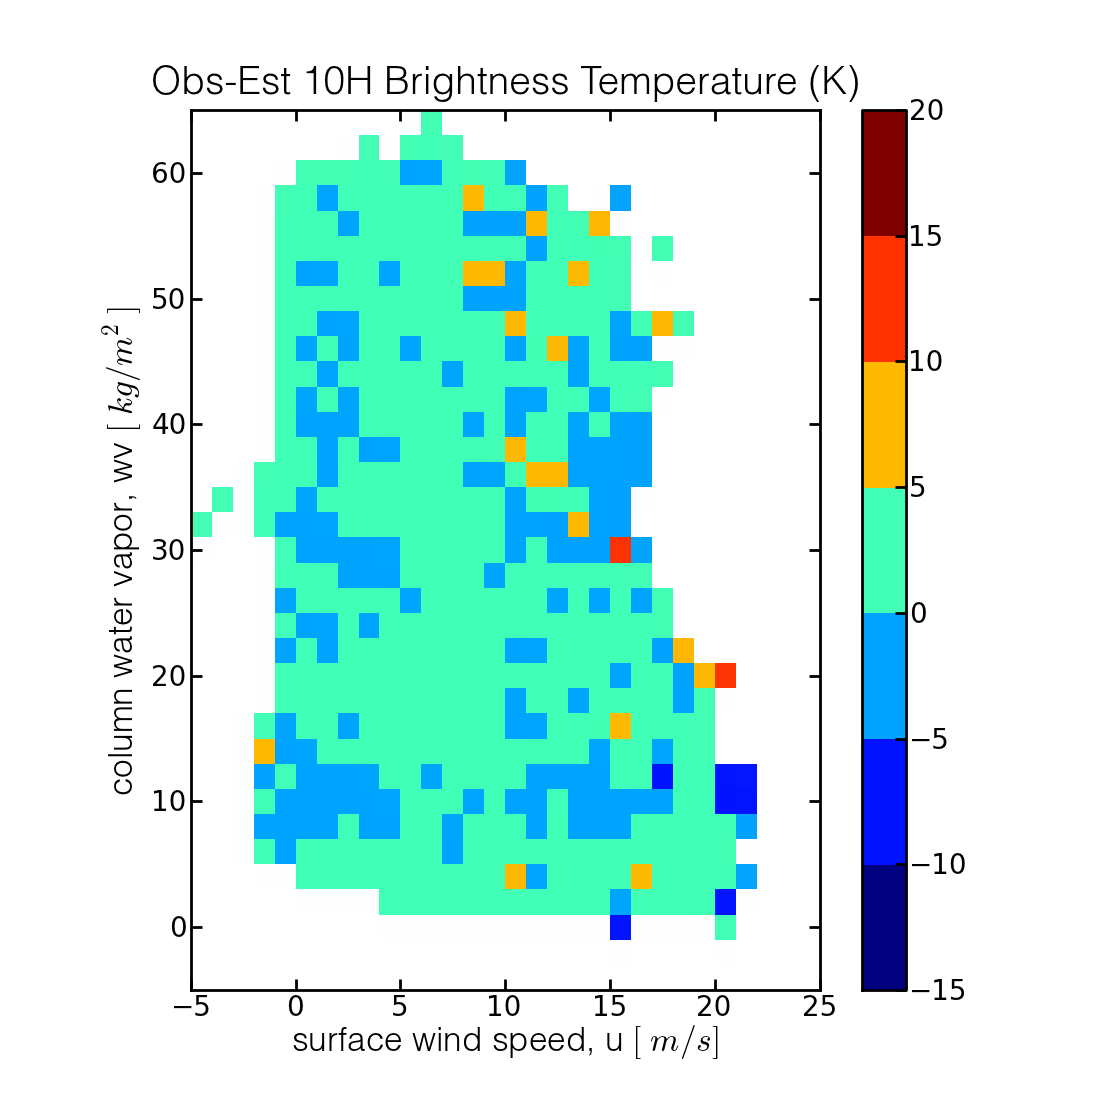
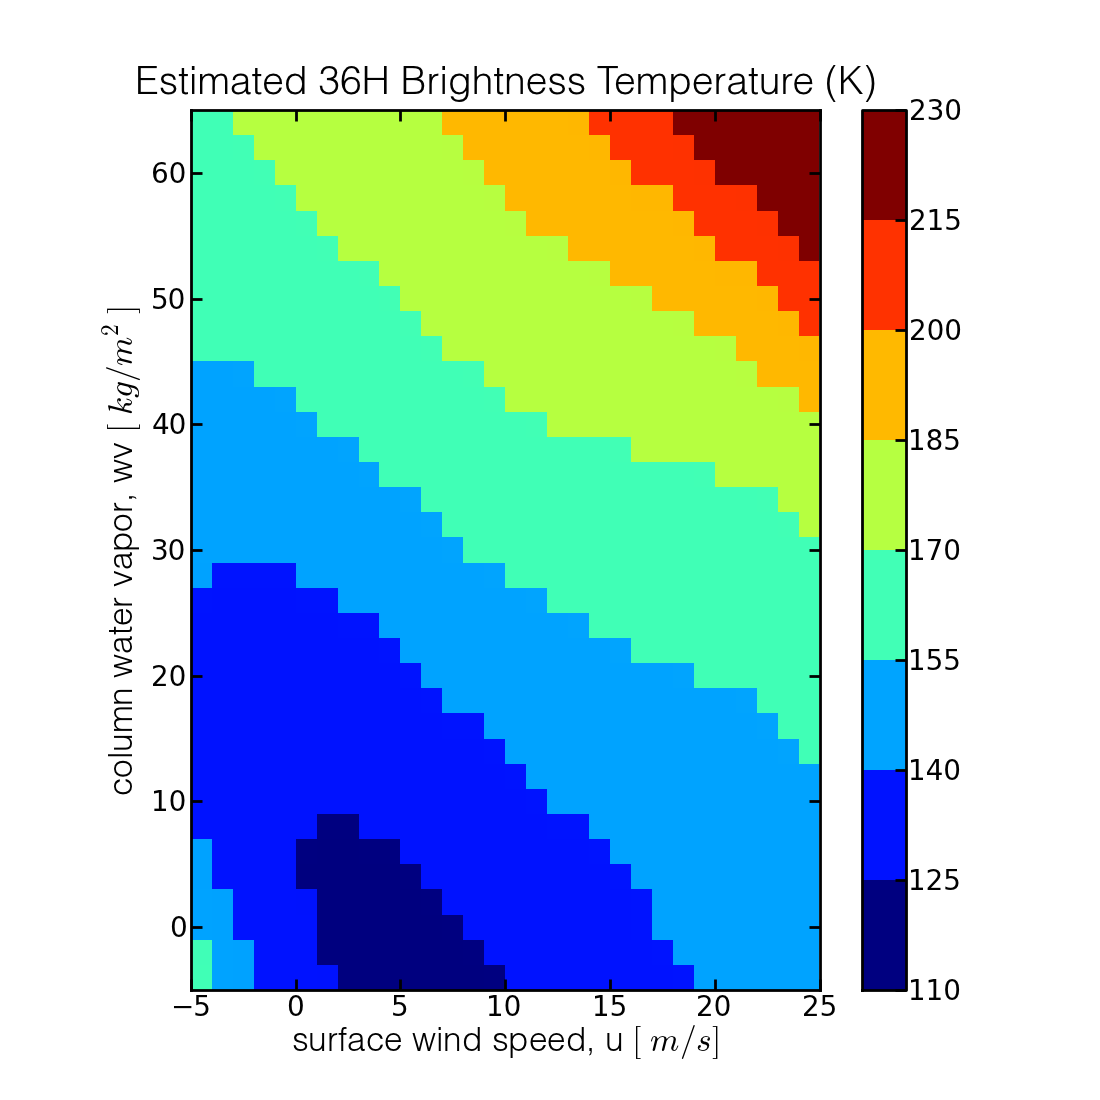
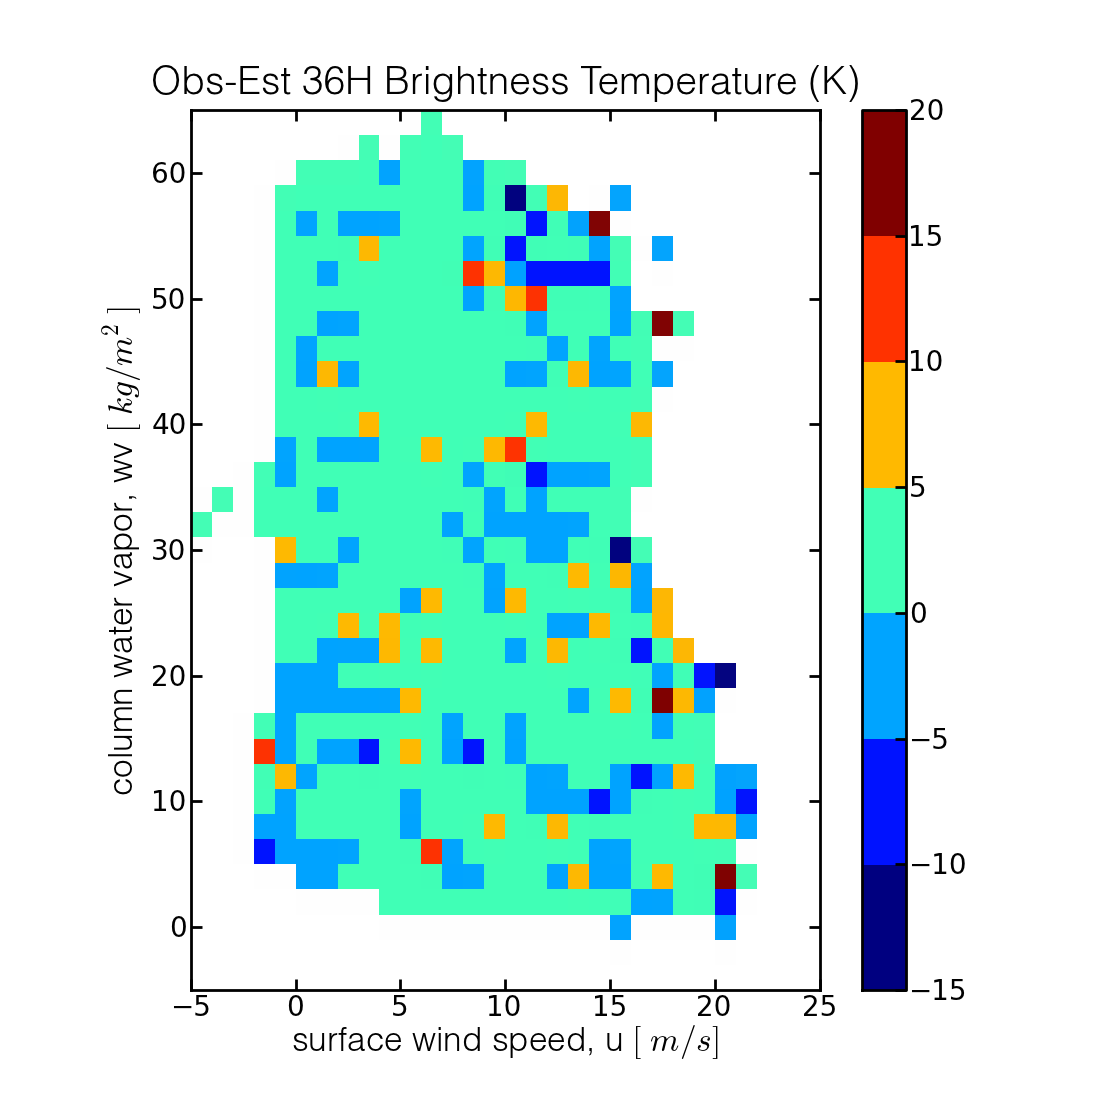
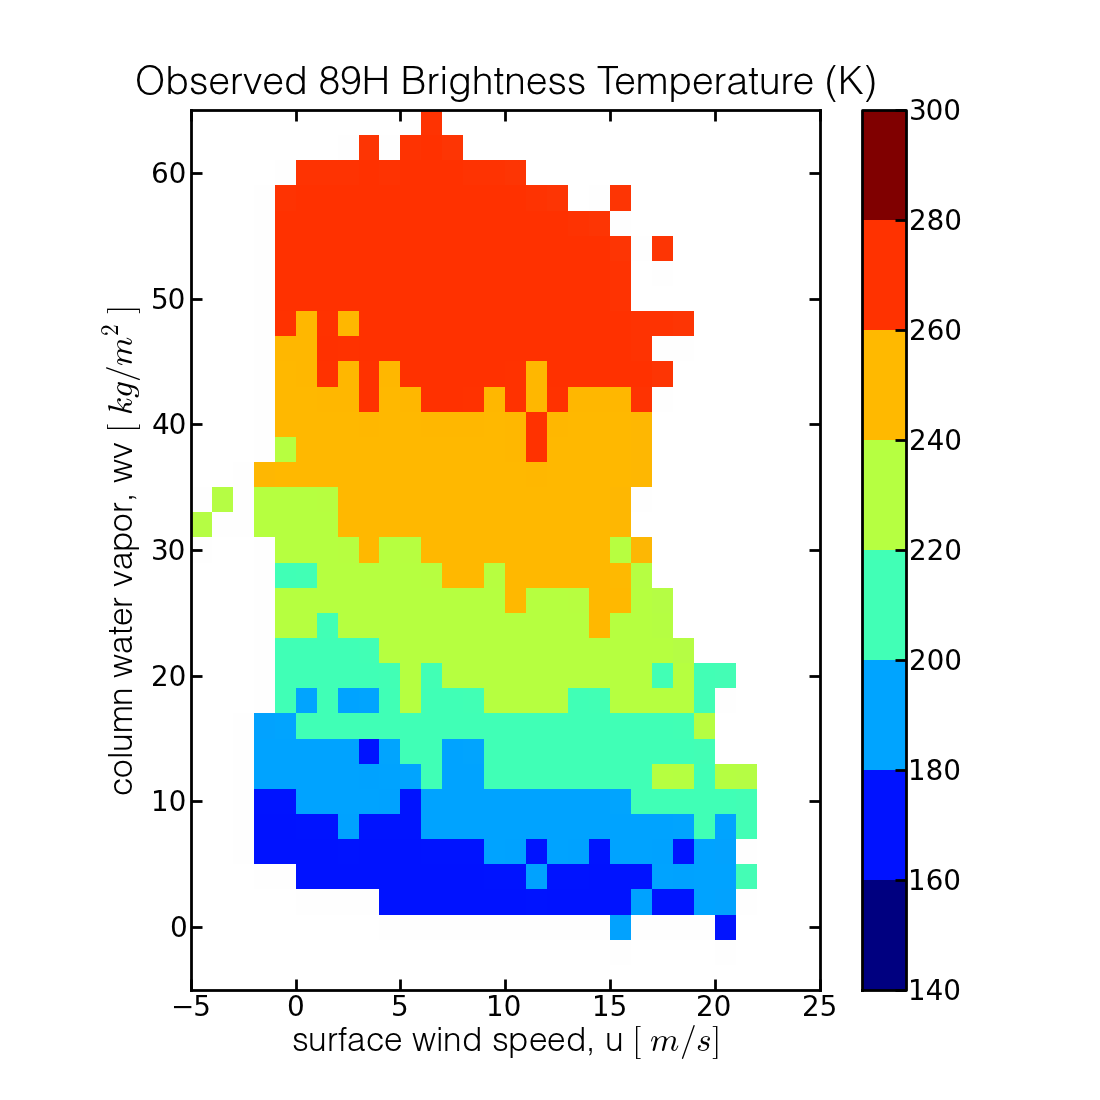
AMSR-E is a dual-polarized microwave radiometer aboard the Aqua satellite platform. AMSR-E brightness temperature measurements may be used to retrieve liquid water path in the atmosphere. To improve the current liquid water path algorithm, quartic regression analysis was performed to reduce systematic error. The result is improved performance in the AMSR-E retrieval of liquid water path. The figures below show results for three AMSR-E channels. Binned averages of brightness temperature as a function of column water vapor and surface wind speed. Empirical regression fits are displayed, as well as the difference between observed and estimated values. The relationship of brightness temperature to retrieved wind speed and column water vapor is given by the following quartic equation.
\begin{eqnarray} T_B \left (U,V \right ) &=& T_{B0} + aV + bV^2 + cV^3 + dV^4 + eU + fUV + gUV^2 + \\ && hUV^3 + iU^2 + jU^2V + kU^2V^2 + lU^3 + mU^3V + nU^4 \end{eqnarray}The terms included are as follows: TB is the estimated brightness temperature, TB0 is the computed brightness temperature, U is surface wind speed, V is column water vapor, and a-n are regression coefficients. Surface wind speed and column water vapor are computed a priori using brightness temperatures from a combination of AMSR-E channels. Differences between observed and estimated brightness temperatures provide a metric for evaluating the performance of the new algorithm at various combinations of surface wind speed and column water vapor.

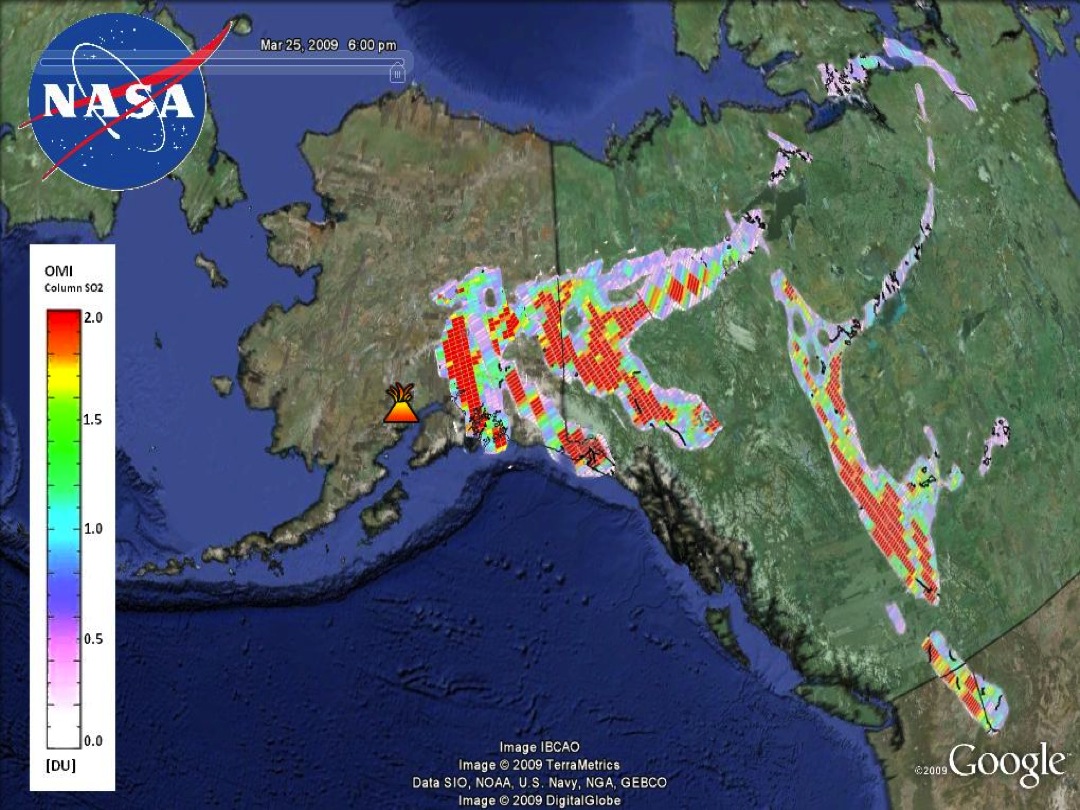
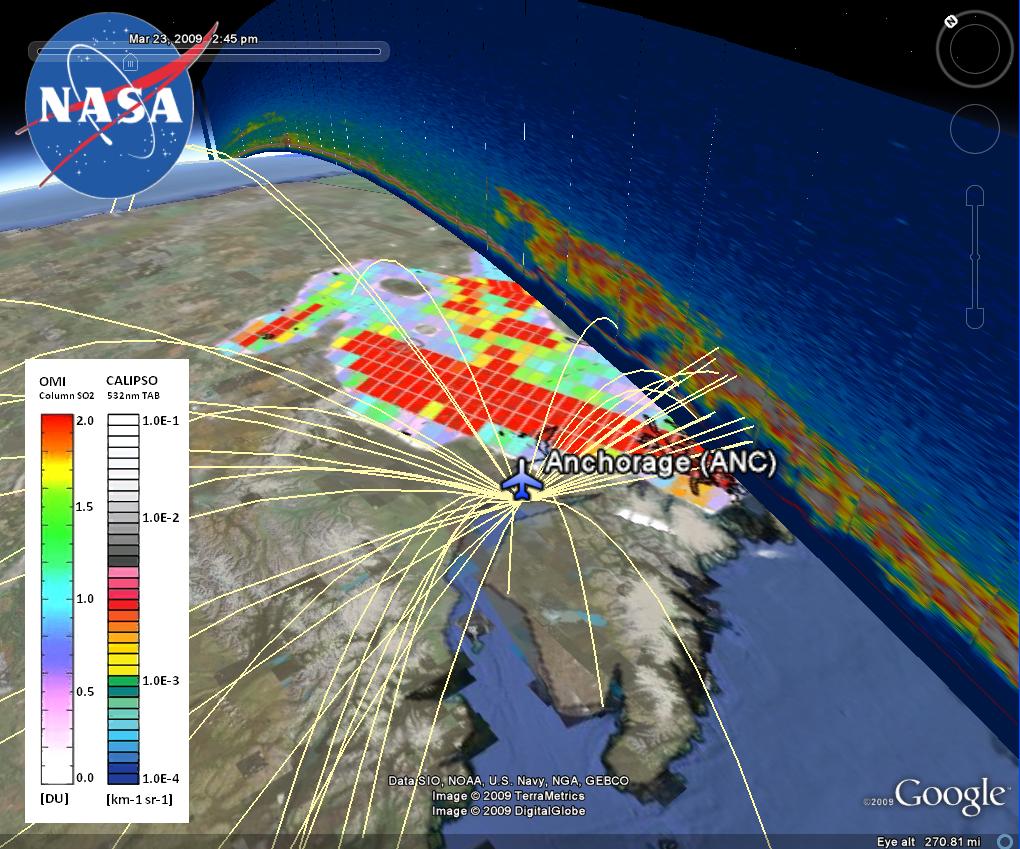
Volcanic Ash Dispersion
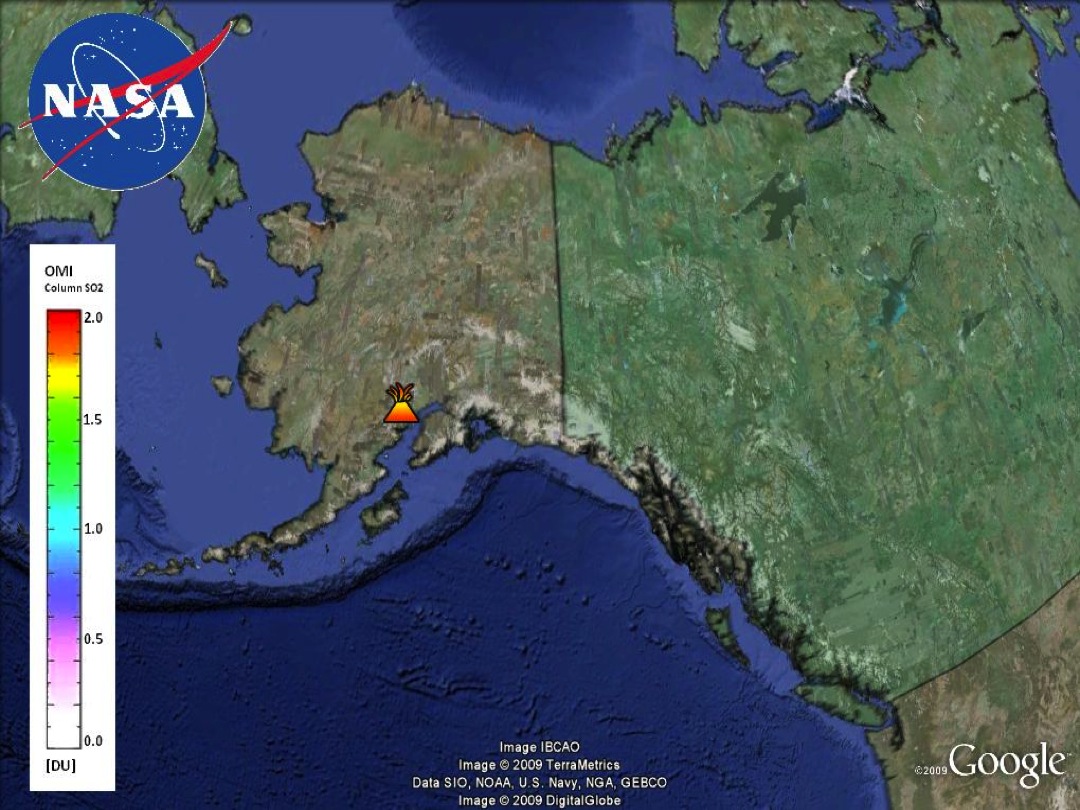
Aircraft in flight routes over Alaska are periodically faced with the threat of volcanic eruptions. Air traffic within close proximity to an active volcano are most at risk for encountering ash. Ash-related aircraft damages have been reported as far as 1800 miles from an eruption. Potential damages include windscreen scouring, communication disruption, and engine failure.
The economic impact to the aviation industry includes not only damages to aircraft but also the costs of rerouting, delaying, and canceling flights. The 1989 eruption of Mt. Redoubt was especially costly due after a commercial flight encountered volcanic ash. KLM flight 867 was able to recover from a 13,000-foot powerless descent over mountainous terrain, however the structural and mechanical damages to the aircraft exceeded $80 million. The total cost to the aviation industry during that year was estimated at $101 million, according to a 1998 economic impacts study.
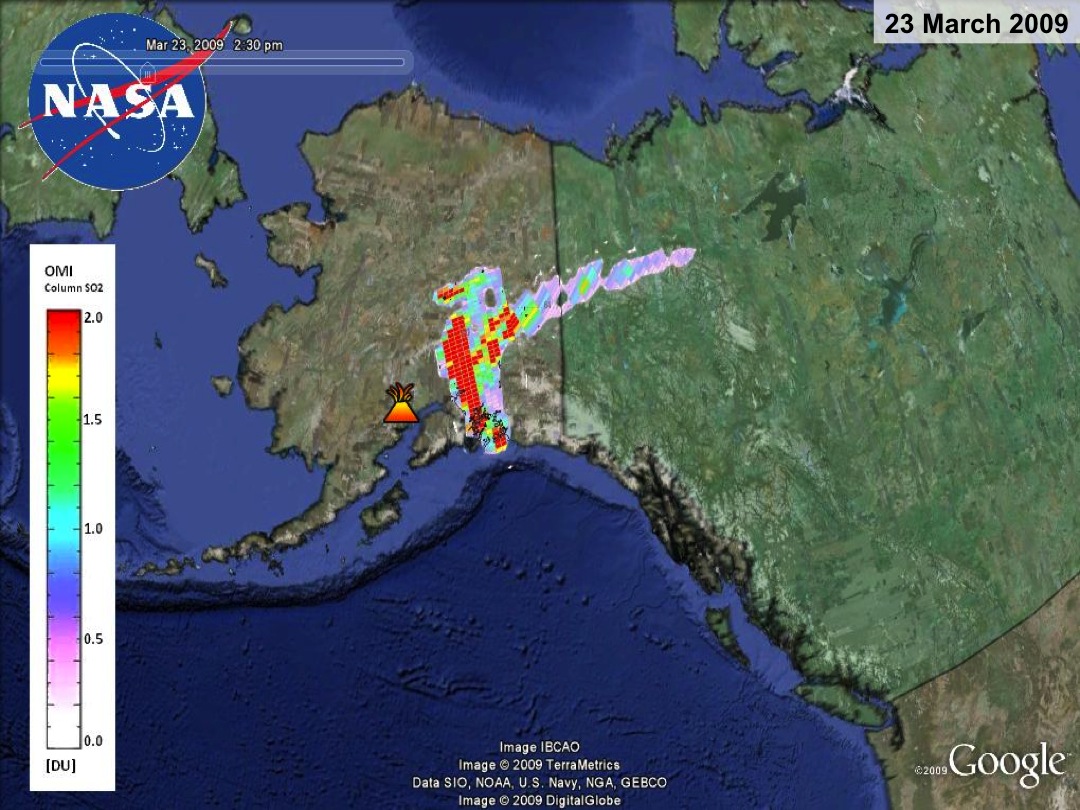
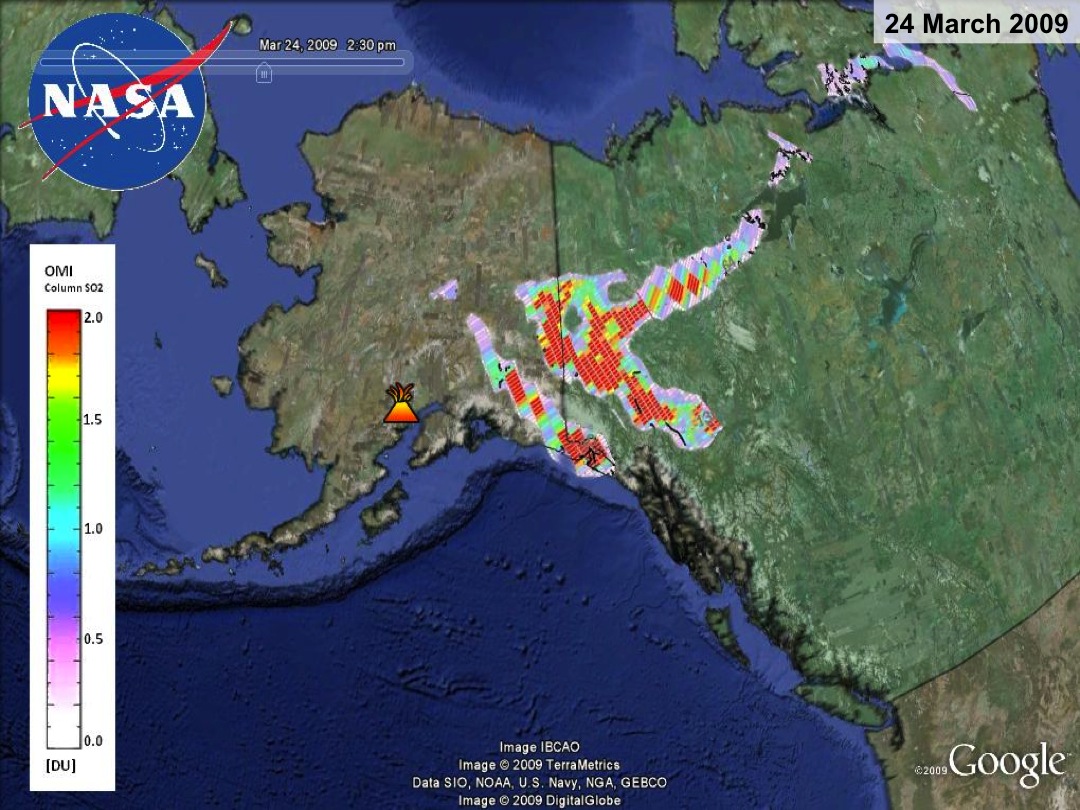
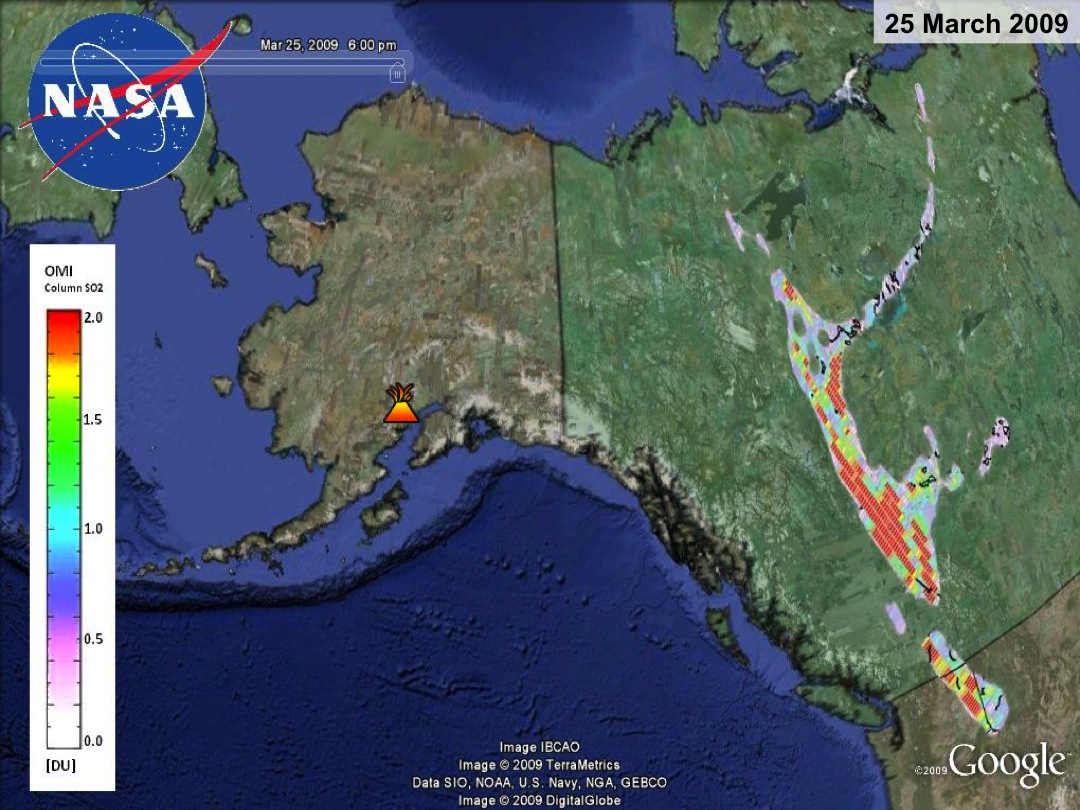
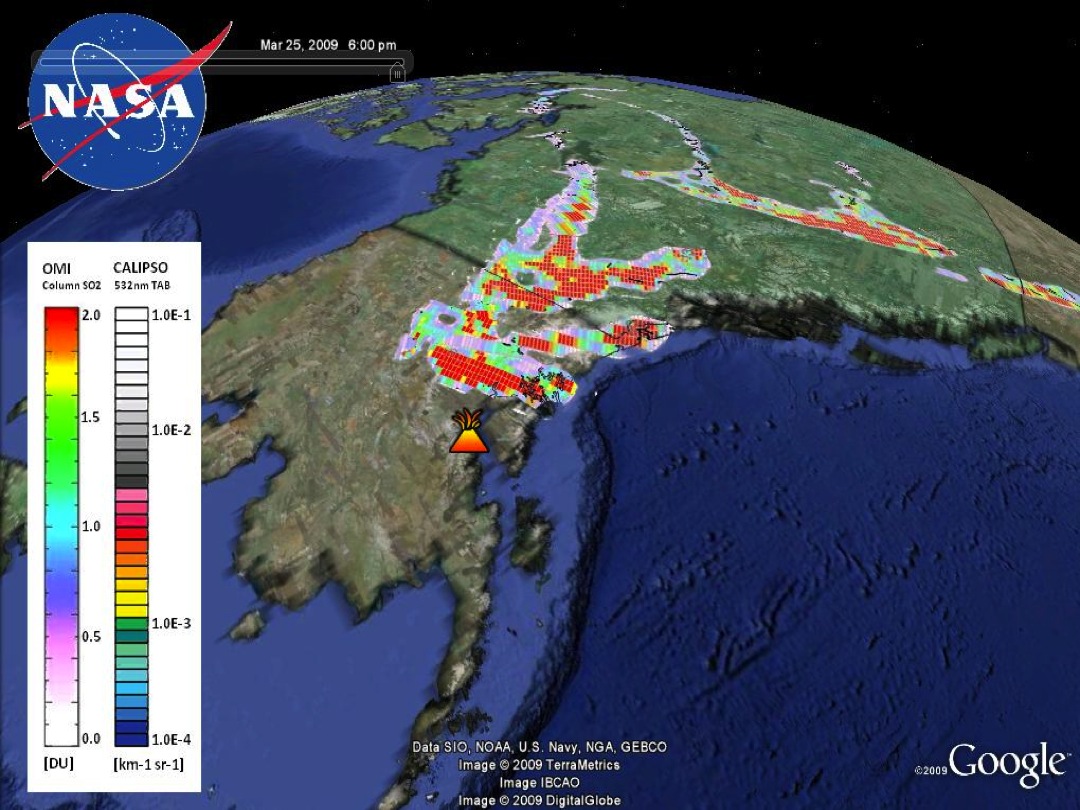
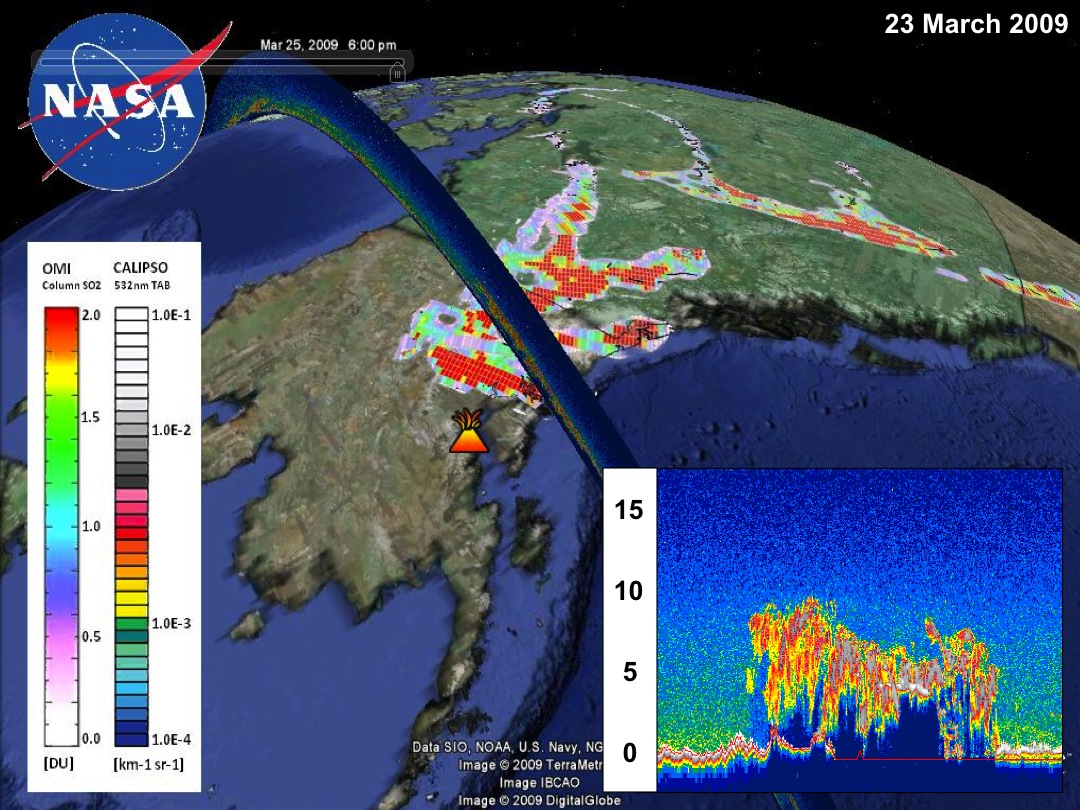
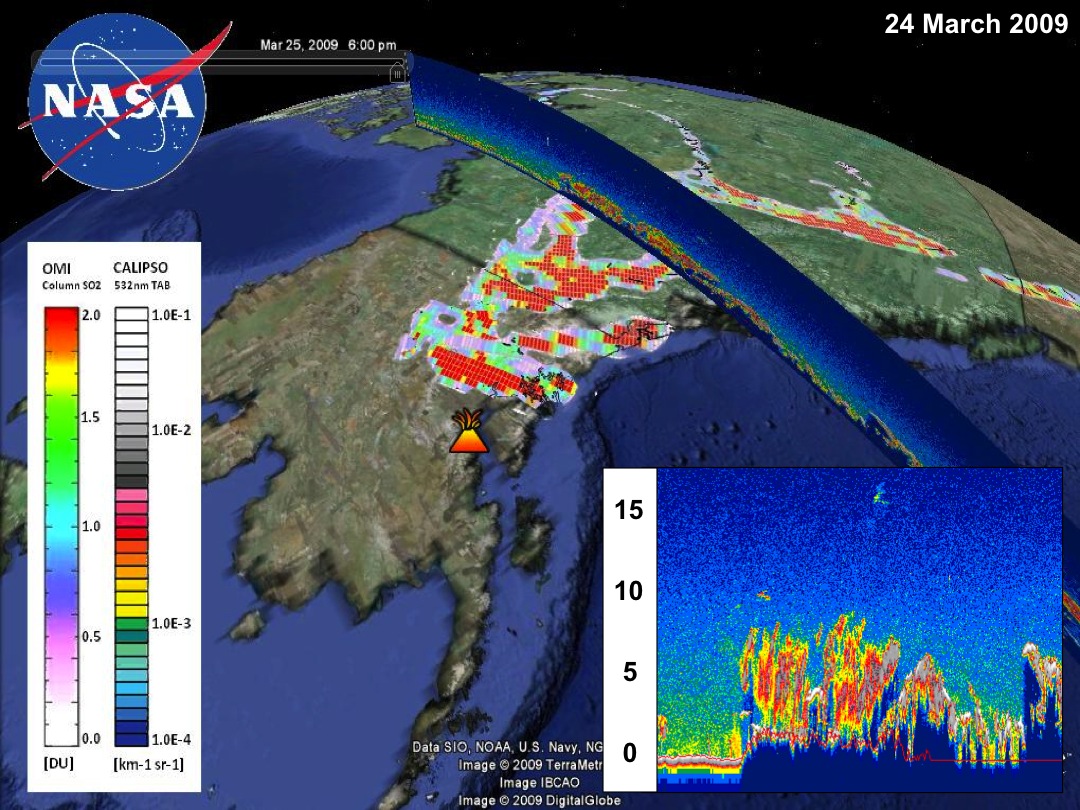
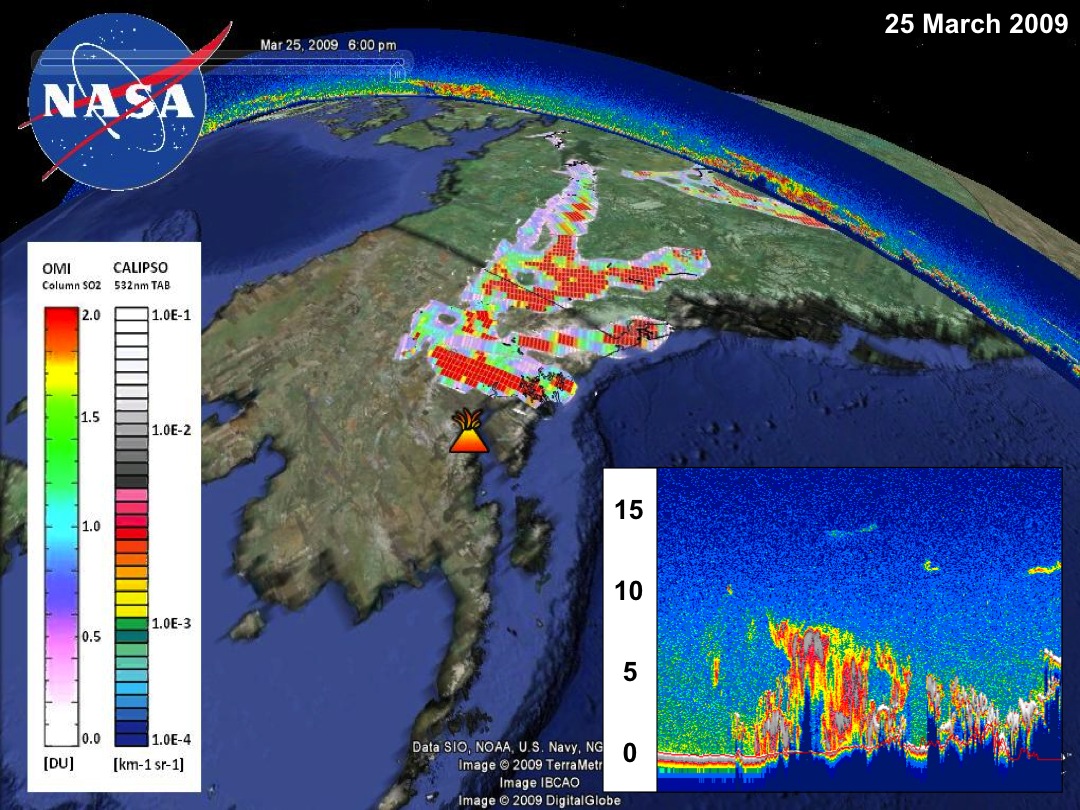
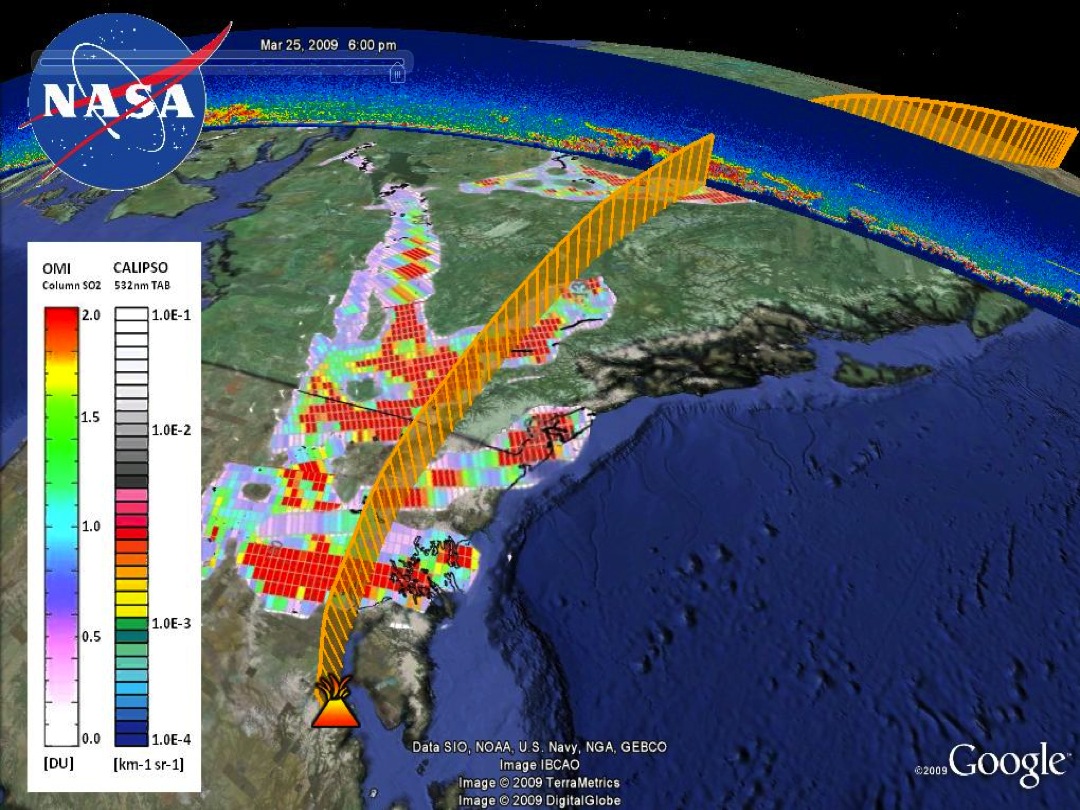
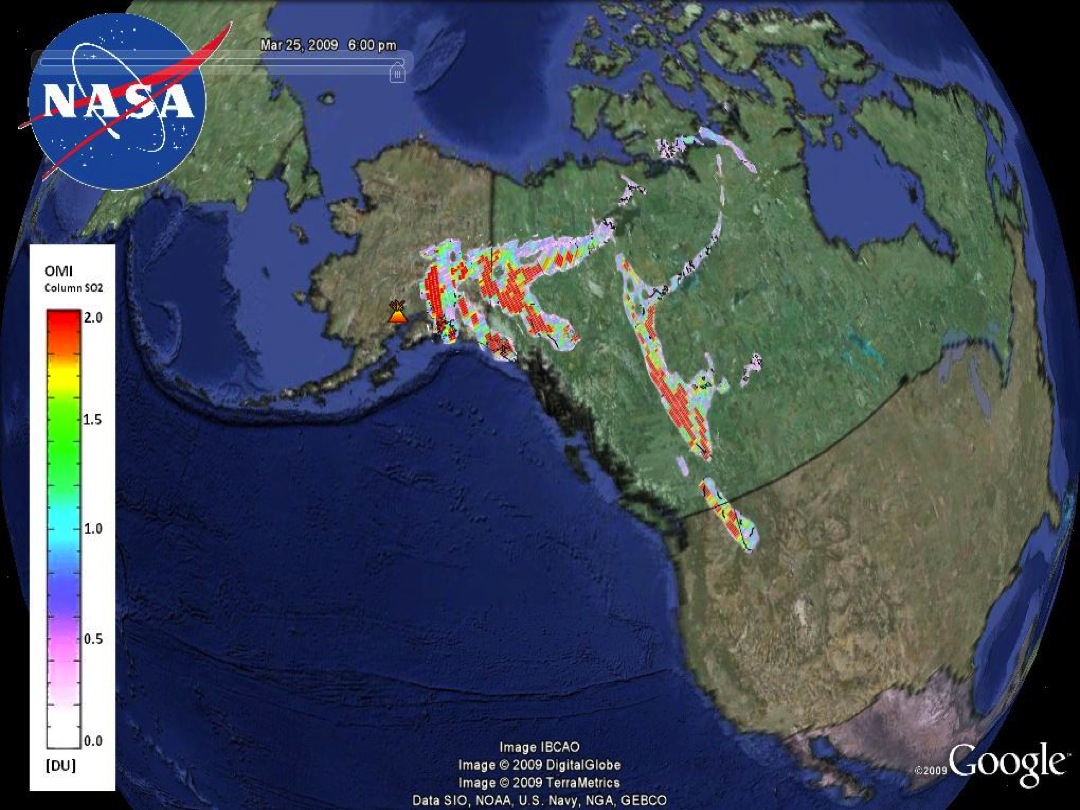
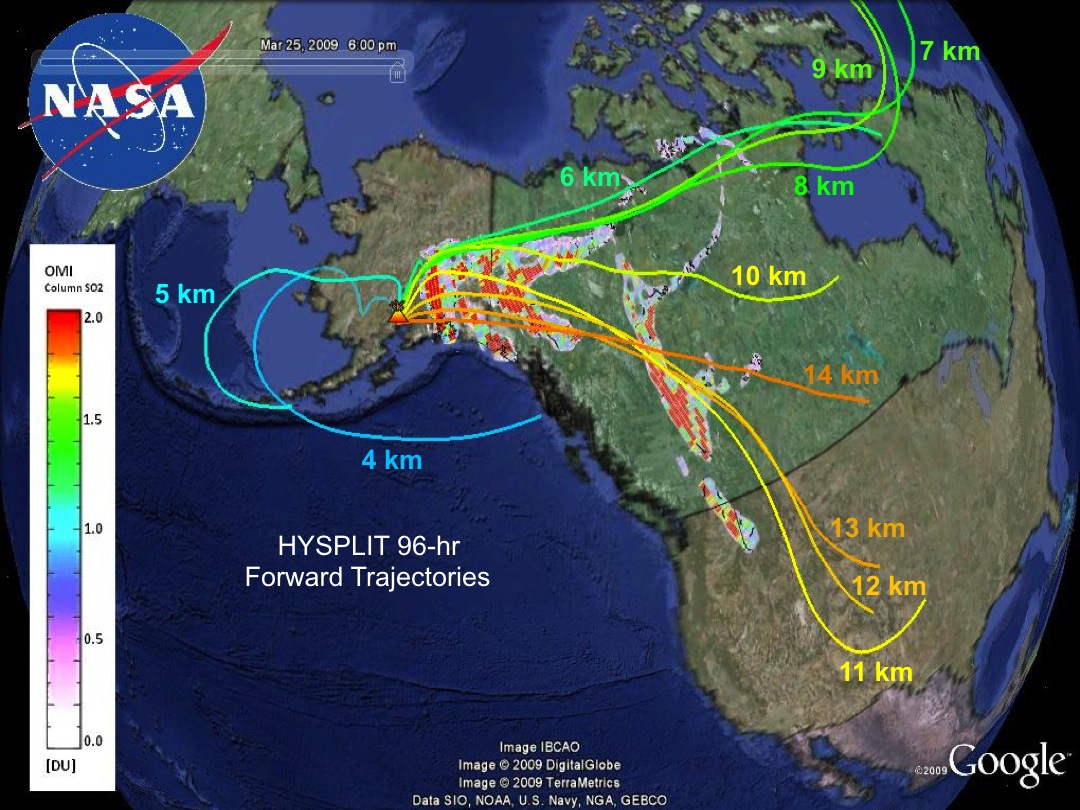
A case study of the 2009 eruption of Mt. Redoubt was performed to examine the vulnerability posed to aircraft by volcanic ash clouds. A series of eruptions occurred during late March and early April 2009. The first major volcanic ash eruption, on 23 March 2009, produced an ash plume exceeding 60,000 feet according to NWS radar observations. The dispersion of volcanic ash was monitored using satellite retrievals, including OMI column SO2 and CALIPSO backscatter data, and model simulations, including HYSPLIT forward trajectories and NCEP/NCAR reanalyses. The figures below show Google Earth visualizations of satellite and model data for three days following an explosive eruption on 23 March 2009.